News Archive
for other/older news items
News
- RECENT HEADLINES
- Thirty Years of Monitoring the Einstein Cross
- LFBOTS — Enigmatic Blue Explosions
- Lensed Supernova Discovered from Ground for First Time
- LT Mural in Liverpool
- Gaia Observed Tumbling After Decommissioning
- Tidal disruption events at galactic supermassive black holes
- Gaia Spacecraft Switched Off and Leaving Earth Space
- Realuminising the primary mirror plus other essential maintenance
- Liverpool Telescope celebrates 20 years of robotic science operations
- New positions at New Robotic and Liverpool Telescopes
- Public access for brightest supernova in a decade
- Scientists observe flattest explosion ever seen in space
- LT tracks brightest ever gamma ray burst
- First detection of a truncated accretion disc in an active galactic nucleus
- Humanity begins its return to the Moon
- A polarised view of the total eclipse of the Moon
- The atmosphere of Triton in greater detail
- First maintenance on LT in two years
- Tracking the JWST
- Liverpool Telescope Unveils a New Type of Cosmic Explosion, Possibly Linked to Black Hole Formation
- Monitoring Maintenance in Geostationary Orbit
- David Carter
- Walk around the LT site
- Two new nova shells discovered
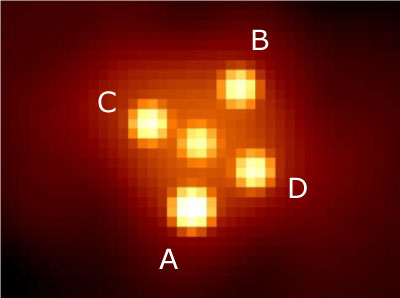
The Einstein Cross. The foreground galaxy is the object in the middle, the more distant quasar lies behind it. Lensed images of the quasar, labelled A-D, surround the foreground galaxy. Image credit: 2020 Alexey Seregeyev (Einstein Cross image), J. Marchant (labels).
A previous news item in 2020 described the collaborative project between research teams in Spain, Ukraine, Uzbekistan and Russia that used the Liverpool Telescope and the Maidanak Observatory (MT) in Uzbekistan to conduct a 2006-2019 monitoring campaign of the gravitationally-lensed quasar QSO 2237+0305, known as the "Einstein Cross" — see First detection of a double caustic crossing in a microlensed quasar.
Now a new paper by the same team has been published recently. "Joining forces: 30 years optical monitoring of the Einstein Cross" by Shalyapin, Goicoechea et al, describes how the LT and MT dataset has been extended further up to 2024, how an extra dataset starting in 1995 was added from a third telescope, and how a new photometric technique has revealed more details of the quasar source and of the lensing galaxy itself.
Quasars are extremely luminous galactic nuclei. At their centre sits a supermassive black hole weighing in at millions to billions of times the mass of the Sun, surrounded by an accretion disc of gas. As this gas falls in towards the black hole it emits huge quantities of light. Quasars have luminosities thousands of times that of a galaxy like our Milky Way.
This particular quasar, QSO 2237+0305, is about 8 billion light years from Earth, and directly in front of it is the galaxy ZW 2237+030, just 400 million light years away or 5% of the distance. Light rays from the quasar are bent by the gravity of the intervening "lensing" galaxy to form four discrete images of the quasar. These images are each much brighter than a direct view of the quasar without the effect of the lensing galaxy.
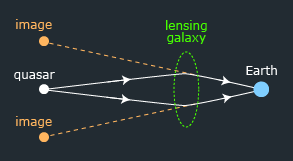
Light from a distant quasar (left) is bent by the gravity of a foreground galaxy in the manner of a lens, bringing the light to a focus at Earth (right). From the Earth's viewpoint the incoming rays make it appear that there are multiple quasars surrounding the true position.
©2020 LT Group
Because the bundles of rays forming each of the four quasar images have travelled through different parts of the lensing galaxy, they can show the additional gravitational effects of any stars passing through the rays. These extra "microlensing" effects temporarily modify the brightness of the quasar images even further.
The original news item described how one microlensing event happened between 2012-2016 when one of the four images exhibited a brightening event characteristic of an individual star in the foreground galaxy passing through the quasar image.
Since 2020, further observations have been made by the LT and MT up to 2024. The dataset was also combined with one from the 1.3m SMARTS telescope — now the Planetary Defense 1.3-meter telescope — at the Cerro Tololo Inter-American Observatory in Chile, that covered the period 1995-2024. That addition made this the longest homogenous multi-band dataset of the quasar to date, with a baseline of about 30 years.
Most of the data from all three telescopes were re-processed using a new photometric method. They found the microlensing signals exhibit sharp variations that depend on wavelength, so they can help resolve the controversy over the structure of the quasar accretion disc. Shorter wavelengths come from the inner parts of the disc, extending to longer wavelengths as the radius increases. The exact relationship with distance however is still to be determined.
This new high-resolution magnitude dataset of the microlensing events enabled the team to not only better constrain the relationship between wavelength and disc radius, but also determine the radius of the accretion disc in g band — between 7-12 light days, or 16-28 times larger than our solar system.
The new wavelength-radius relationship however differs from the standard model, leading to the possibility that the accretion disc may not be the sole source of UV-optical continuum radiation. This new dataset demonstrates that microlensing is able to reveal these deviations from a standard accretion disc scenario.
Links
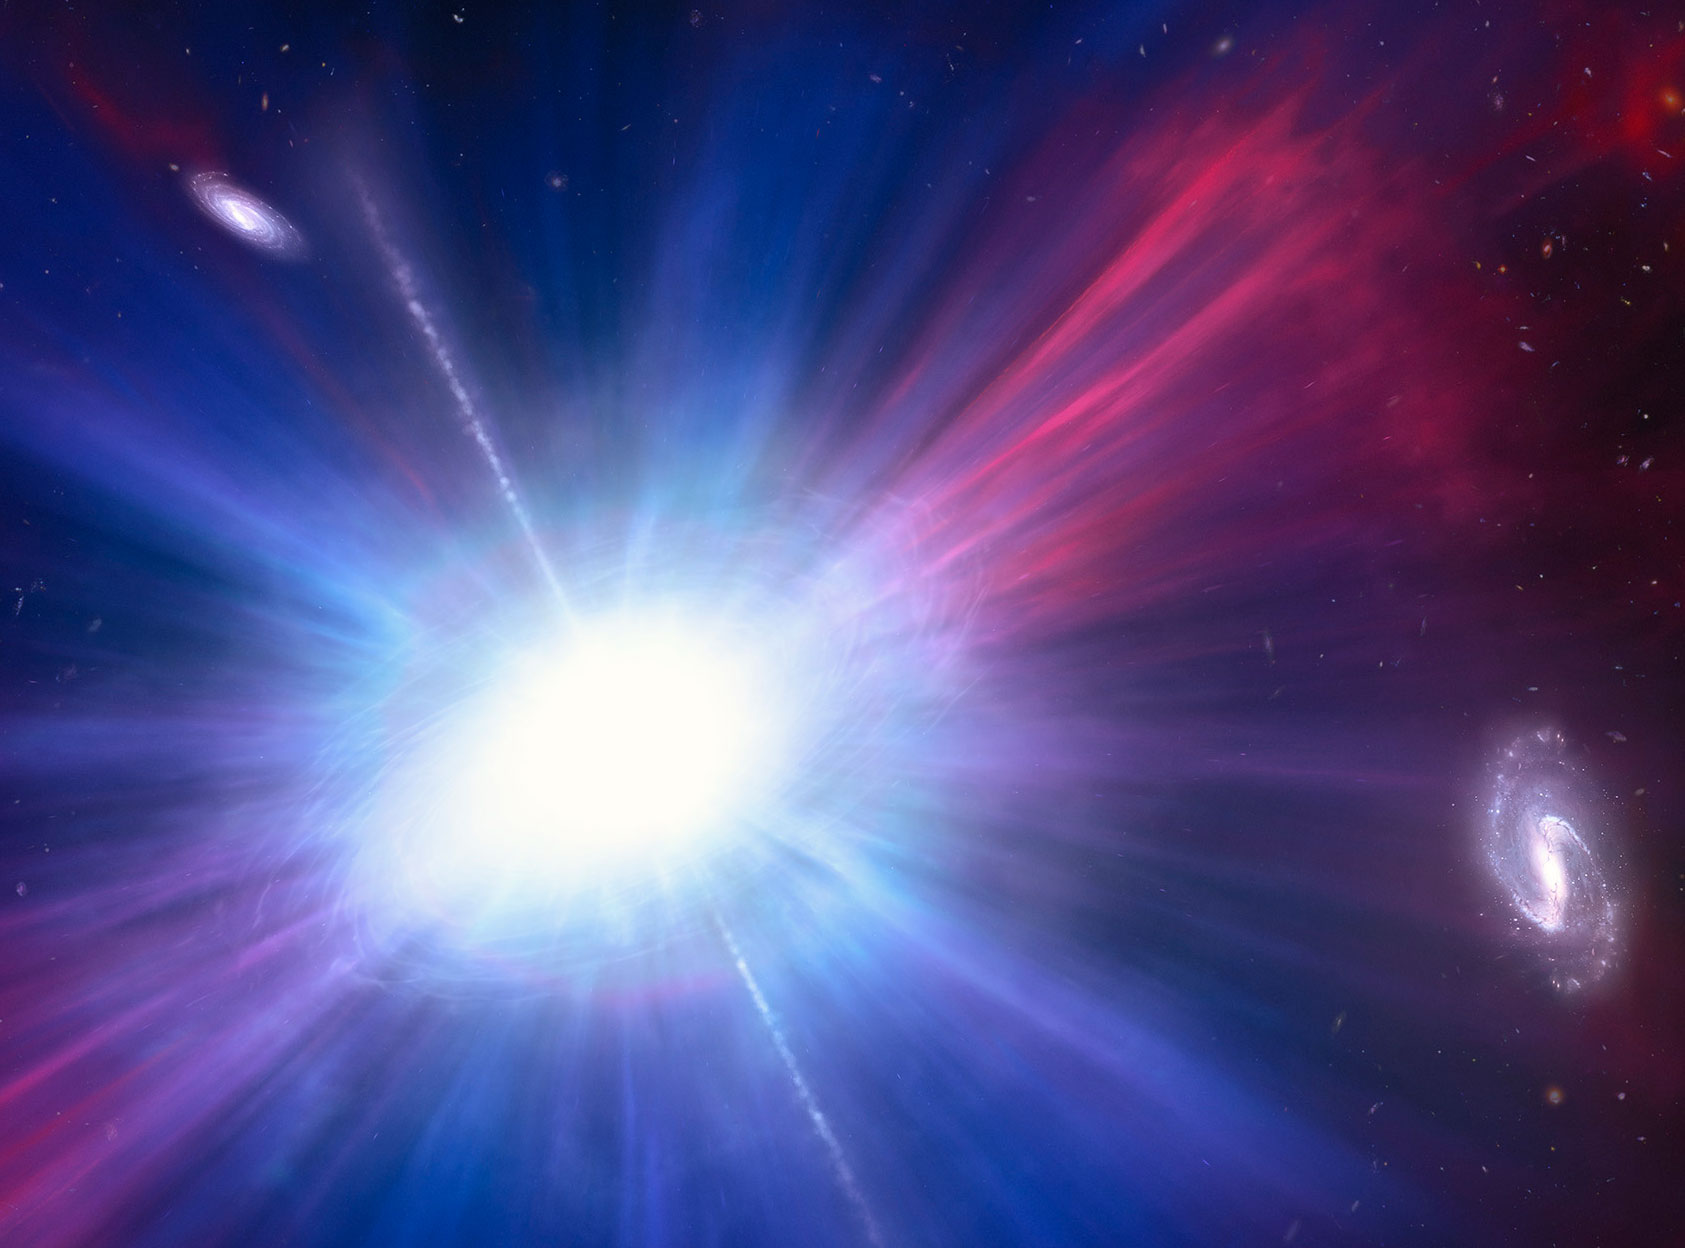
Artists' impression of a luminous fast blue optical transient (LFBOT). Adapted from an image by NASA, ESA, NSF’s NOIRLab, Mark Garlick, and Mahdi Zamani.
Two recent papers (linked below) by Dr Dan Perley and Dr Conor Omand detail the involvement of the Liverpool Telescope (LT) in helping astronomers to understand a class of rare and mysterious cosmic explosion, the latest of which happened relatively nearby.
Luminous Fast Blue Optical Transients (LFBOTs) are a growing class of enigmatic energetic transients, brilliant cosmic explosions that brighten quickly and shine mainly in the blue part of the spectrum. Unlike typical supernovae, these events have a rise time of no more than a few days, an absolute magnitude of about -20, and a hot (>15,000K) featureless spectrum lasting for weeks after peak brightness. They also emit brightly in X-ray, radio and millimetre wavelengths.
The high luminosity implies a substantial release of energy, but the fast rise time and absence of spectral features imply little ejected matter. The rapid variability of the source brightness indicate an unstable and energetic compact object as the central engine behind the explosion.
These objects do not fit into the known categories of stellar explosions, and there is currently no consensus on the nature of these objects. What's more, LFBOTS are rare so there are only a few examples to study. Only a few are detected every few years, in wide field surveys like the Zwicky Transient facility (ZTF) and the Asteroid Terrestrial-impact Last Alert System (ATLAS). Once detected, the call immediately goes out to other facilities for much more detailed high-cadence followup observations in multiple wavelengths, so that the evolution of the explosion can be characterised as completely as possible.
Such an alert went out on 25th September 2024, when ZTF detected the most optically luminous LFBOT to date. Later analysis would show this was also the fourth closest LFBOT known, at just over a billion light years away. It was assigned the name "AT 2024wpp" (nicknamed "Whippet"), and prioritised for immediate followup.
Thanks to the scheduling flexibility afforded by its rapid-response capabilities, the LT was one of the first of a cadre of facilities to obtain these crucial early-time followup observations. Three of its battery of seven sensors were pressed into service immediately to obtain high-cadence data in all filters — the IO:O optical camera, LIRIC infrared camera and SPRAT spectrograph.
Other facilities adding to the data haul were: the Rainbow Camera on the Palomar 60-inch telescope; the Panoramic Survey Telescope and Rapid Response System (Pan-STARRS); the Wide-Field Infrared Survey Telescope (WINTER); the Goodman High-Throughput Spectrograph (GHTS) on the Southern Astrophysical Research Telescope (SOAR); the ESO Faint Object Spectrograph and Camera v2 (EFOSC2) on the New Technology Telescope (NTT); and the Focal Reducer/Low Dispersion Spectrograph 2 (FORS2) on the Very Large Telescope (VLT).
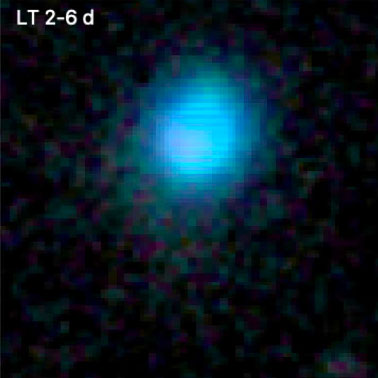
LT IO:O image of AT 2024wpp, a stack of multiwavelength data from the first five nights of followup. Image ©2026 Dan Perley & Liverpool Telescope.
The high-cadence multiwavelength lightcurves from all of these facilities gave the paper authors a good picture of the explosion unfolding over time. Existing models of many scenarios were compared to the light curves - supernovae, magnetar engines, shock cooling, tidal disruption events, compact object mergers, jets, synchrotron blast waves and accretion discs. Yet none of them matched - none could reasonably explain what was seen.
The data instead suggests something like a powerful rapidly-accreting central engine, blowing a fast (15% speed of light) wind into the surrounding medium, while also irradiating it with X-rays. How all that could have come about is maybe tidal disruption of a low-mass star by an intermediate-mass (100-10000 solar mass) black hole, combined with synchrotron blast-wave emission.
The featureless spectrum suggests the stellar wind is so hot and fast that intense ionisation and doppler broadening smear out any identifiable features, rendering them undetectable. However, for AT 2024wpp, two very narrow peaks appeared in the spectrum 35 days after the event began. This suggests stable structures of denser material, which might be streams of tidal ejecta, or perhaps the ablated remains of a companion star.
So the mystery remains, at least for now. But there is a clear need to continue to monitor the sky at high cadences for relatively nearby bright objects, so they can be followed up immediately and extensively by smaller facilities, leaving the larger ones to track the lightcurves out to later times.
Relevant links

Illustration taken from the LJMU press article. Light from the supernova that would have missed the Earth is bent by the intervening galaxy's gravity to come to a focus at the Earth.
(adapted in part from LJMU press article)
LJMU Astrophysics Research Institute (ARI) astronomers using the LT have made the first ground-based observation of a lensed supernova in another galaxy.
Initial discovery of the supernova was made by the Zwicky Transient Facility (ZTF), a 1.22m optical telescope in California USA, that lacked the resolution to see that the event was actually lensed into multiple images. That higher-resolution discovery was made by the LT using its IO:O camera that was able to resolve the supernova into its four separate images.
The supernova went off in a galaxy 10 billion light years away. Light rays that would have just missed the Earth were instead bent by an intervening galaxy's gravity to come to a focus at the Earth. The gravitational lens is not perfectly symmetric so the supernova does not appear as a single distorted image but rather as four discrete images.
“When light is lensed, the different paths the light follows to get to Earth don't all have the same length, so light moving along different paths takes variable amounts of time to reach us,” said ARI PhD student Jacob Wise. He was the first to realise the supernova was lensed when studying the IO:O data.
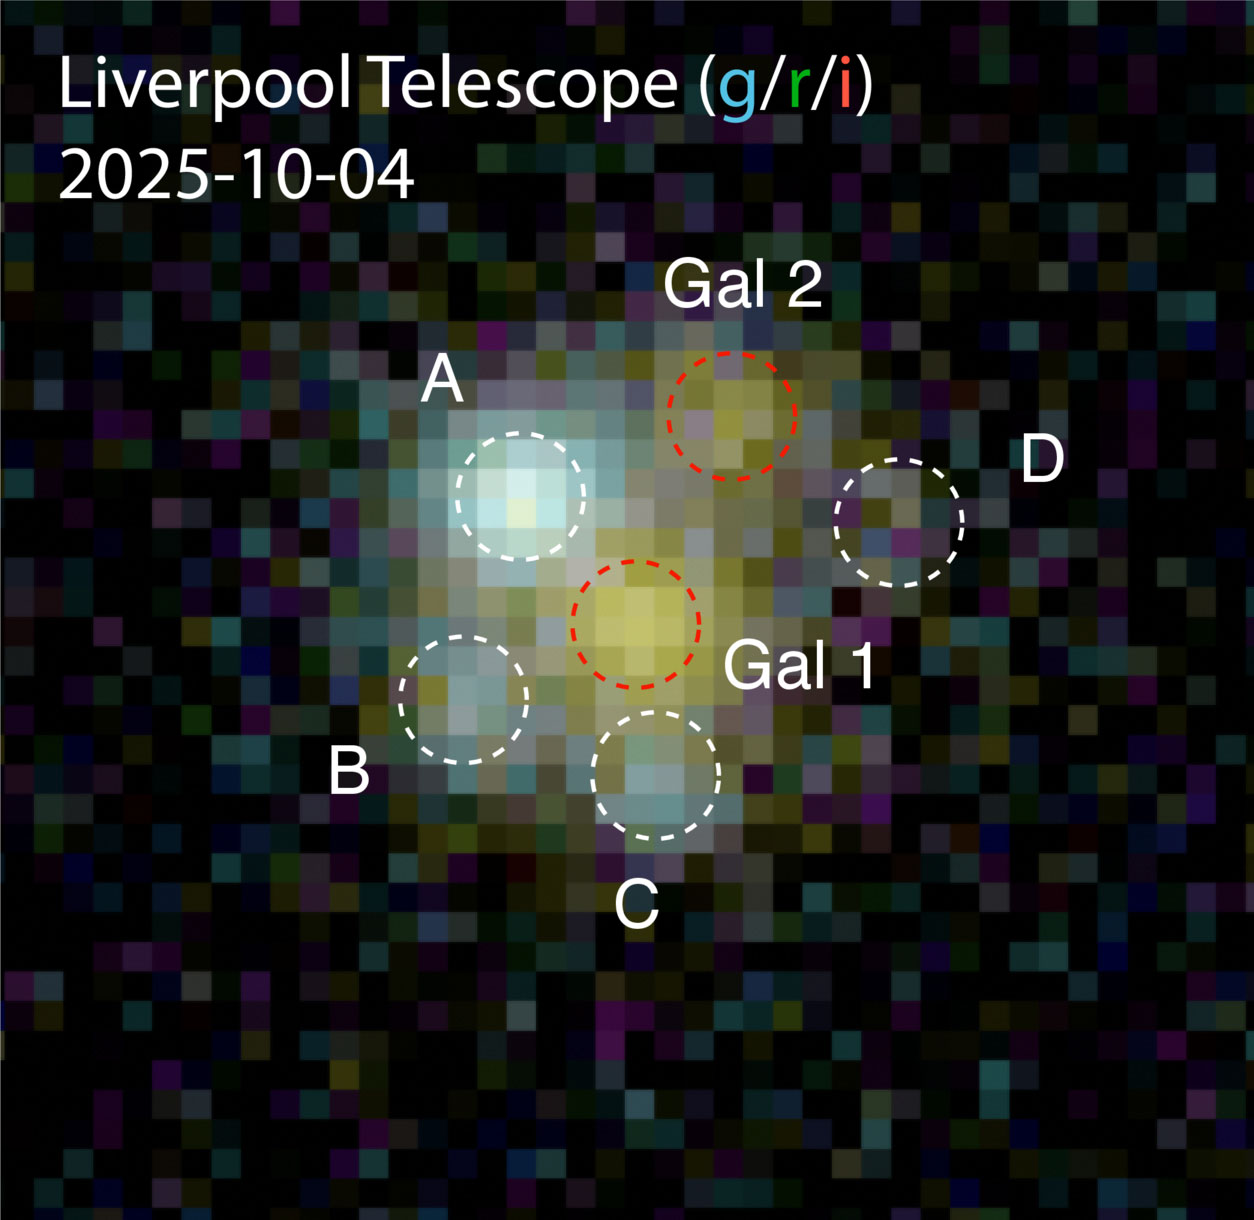
LT discovery image of the lensed supernova. It's a false-colour image made from stacked exposures through green, red and deep red filters. The multiple images of the lensed supernova are denoted A-D, and two galaxies "Gal 1" & "Gal 2" lie in the foreground. Pixels are 0.3 arcsec across. © 2025 D. Perley
Each of the four lensed images (see right) are therefore showing the same months-long supernova event, but at different points along its timeline. A rough analogy would be four TV screens showing the same movie but all out of sync with each other. As the supernova "movie" is played out, fluctuations in the most advanced image will eventually be repeated in the others.
“What's exciting about that is that the amount of time difference between different images depends on the expansion rate of the universe,” explained Dr Daniel Perley, a reader in astrophysics at the ARI.
By precisely measuring the time delay between the images, it should be possible to determine more exactly how fast the universe is expanding. This in turn would tell us about the dark energy force that is believed to cause the universe's expansion to accelerate.
There are two competing values for the expansion rate of the universe. One is based on studies of the afterglow of the big bang, the other from observations of nearby galaxies. Perley suspects this supernova calculation will help cast the tiebreaking vote, saying "studies of lensed supernovae could indicate which of these two numbers we should really believe.”
The full story is published in the journal Astrophysical Journal Letters with the title "Discovery of SN 2025wny: A Strongly Gravitationally Lensed Superluminous Supernova at z = 2.01". The authors are Joel Johansson, Daniel A. Perley, Ariel Goobar, Jacob L. Wise, Yu-Jing Qin, Zoë McGrath, Steve Schulze, Cameron Lemon, Anjasha Gangopadhyay, Konstantinos Tsalapatas, and 24 other co-authors.
The supernova is now being studied across the world. The Liverpool Telescope was the first facility to see the multiple images and thereby prove it was gravitationally lensed. It was later followed up by the Keck Telescopes in Hawaii, the Hubble Space Telescope, and the James Webb Space Telescope.
Relevant links

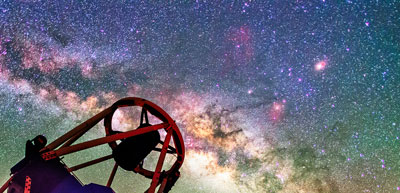
The LT mural on display in College Lane, Liverpool.
As part of the British Science Festival in Liverpool this year, a mural of the LT was created by well-known Liverpool street artist Paul Curtis, and is on display in the city centre.
Based on a still from this movie of the LT by Daniel López, the mural measures 5x7 metres, and shows the LT silhouetted against a panoply of stars.
It would have been too difficult to paint the mural at its designated display site, so it was constructed on the floor of one of the gymnasiums at Liverpool John Moores University instead.
More information can be found on the Schools' Observatory site.
The mural can be seen in Liverpool city centre, above the entrance to the Roxy Ballroom on College Lane, at the junction with Hanover Street (see map below).
[Update 28th Nov 2025 - The mural was taken down on 21st November. It is currently in storage at LJMU, and could be put up again sometime in the future at a different location.]
Map of mural location, click for bigger version.

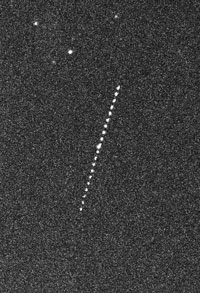
Gaia imaged by the LT on the night of 27th March 2025, some 14 hours after passivation. The image sequence runs from 22:55 - 23:43 UTC. Gaia is moving diagonally towards lower right. The near-horizontal streak in the first frame is due to a foreground geostationary satellite.
As an update to our April news item about Gaia, we can now reveal that the spacecraft started wobbling or tumbling after its deactivaion in March, as shown by LT data taken at the time.
To recap, Gaia finished its science mission in January of this year, and was deactivated on the morning of 27th March. This involved commanding Gaia to boost out of its Lissajous orbit around the Sun-Earth L2 Lagrange point, 1.5 million km from Earth, vent any remaining propellant, and finally shut itself down.
Later that same day the LT observed Gaia again (see right), but the image sequence showed it to be flickering between magnitude +17 & +22, rather than having a steady brightness as before.
Previously, Gaia's sunshield was kept at a fixed angle to the Sun and Earth. This new fluctuation suggested Gaia might be undergoing large-amplitude precession and/or nutation, or even tumbling end-over-end.
Dr Martin Altmann, director of the Gaia Ground Based Optical Tracking (GBOT) campaign, analysed this data plus that from further intermittent observations (mostly by LT) over the following weeks. The full analysis can be seen in an "Image of the Week" article in the Gaia section of the "Cosmos" Science Users' Portal of the European Space Agency (ESA) website.
In the article, the rotation period is initially deduced to be approximately 20 minutes. However, Altmann is quick to point out that there might be up to four reflective surfaces involved - both sides of the sunshield and the spacecraft's cylindrical hull. The period might for example be more like 40 minutes, involving two reflections from both sides of the sunshield. This, plus an evolving Sun-Gaia-Earth phase angle, yields an overall complex reflection signature which makes it difficult to conclude a rotational period from this data.
Martin Altmann's full article can be found on tne ESA website at https://www.cosmos.esa.int/web/gaia/iow_20250929.

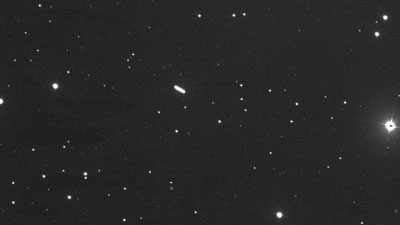
The LT's last image of Gaia (arrowed) in a long exposure on 29th May 2025. The telescope tracked on Gaia's expected trajectory, so the streaks are stars in the background. The small dots are cosmic ray hits on the CCD. North is at top, and the field is about 100 arcseconds wide.
The LT's last detection of Gaia (see right) was on the early morning of 29th May, when the peak brightness had diminished to magnitude +20.7. Gaia was still only about twice as far as it had been during its standard science mission (3.15 million km), so this drop in brightness seemed unusual at first. However, it was likely due more to the evolving Sun-Gaia-Earth phase angle rather than distance. Earth was now probably moving out of the main part of Gaia's relatively narrow (compared to diffuse reflection) specular beam of reflected sunlight.
Gaia is now (13 Oct) over 28 million km away, drifting further and further behind the Earth in its larger heliocentric orbit. In 14 years it should fly by Earth again (as we "lap" Gaia around the Sun), at a safe distance of about 10 million km. If Gaia is still tumbling by then, its peak magnitude as estimated by Altmann will be 23-23.5.
As stated previously, Gaia's duty is finished, but work continues to analyse and publish its data. The enormous catalogues of Data Releases 1-3 actually only make up under a third of the total information to be released. Data Release 4 is due at the end of 2026, and Release 5 after 2030.

Artist's impression of a Tidal Disruption Event.
Image credit NASA/JPL-Caltech, 2022.
The LT was recently used to conduct a polarimetry monitoring campaign that targeted bright, long-lasting optical flares at the centres of five active galaxies. Debate exists on the physical mechanisms behind these transient events, and these new observations go some way to address the issues.
Most large galaxies harbour a supermassive black hole (SMBH) at their centres, and about 10% of these are "active". Active galactic nuclei (AGNs) are exceptionally luminous, thought to be caused by the black hole actively accreting matter.
The accretion process releases enormous amounts of enegy. Gas spiralling into the black hole forms an accretion disc, and through the release of gravitational forces and friction, the gas in the disc is heated to extremely high temperatures. The blackbody radiation thus emitted ranges from higher energy extreme ultraviolet/x-ray near the black hole to lower energy optical and infrared further out.

Simulation of star debris evolution during tidal disruption event (click for larger version). Annotated frames from video by NASA’s Goddard Space Flight Center/Chris Smith (USRA/GESTAR). Annotation by J. Marchant.
Most other galaxies with a central SMBH have no supply of infalling gas, so the SMBH is quiescent, and there is no AGN output. However, most galactic nuclei also host a dense cluster of stars. They are packed so tightly here that gravitational interactions between them are common, so some might end up on a collision course with the SMBH itself.
A star crossing the tidal radius of the SMBH would be partially or completely ripped apart in a tidal disruption event (TDE). A full disruption sees about half of the star debris leaving the SMBH vicinity entirely, but the rest remains gravitationally bound in various elliptical orbital streams.
As the streams interact with each other the friction and shock compression causes the debris to heat up and emit large amounts of radiation. It also loses orbital energy and the gas spirals into the SMBH, forming an accretion disc in the process, and emitting more radiation in a similar manner to that outlined above.
Normally quiescent galaxies might therefore undergo an occasional TDE-generated flare. The flare lasts from a few months to a few years, depending on the masses of the SMBH and the disrupted star, which in turn influence how much debris is produced and how fast it is accreted.
It was initially thought TDEs would peak in the extreme ultraviolet (EUV) and soft x-ray region. However, first observations saw the peak in the lower-energy UV/optical range instead.
This might be due to lower-orbital energy debris stream interactions, before the higher-orbital energy accretion disc has formed. Or it might be that the high energy EUV/X-rays from the disc centre are being blocked and reprocessed to lower-energy light by gas in the disk obscuring a direct view.
In an effort to constrain these models and obtain an idea of the geometry of the situation, Lorente-Mitjans et al observed a selection of recent candidate TDEs in polarised light. Polarisation can tell a lot about the engine powering the flares - colliding debris in elliptical orbits emit highly polarised light for instance, while reprocessed light from the disc is only mildly polarised.
The team used the LT's MOPTOP polarimeter to observe five TDE candidates. AT2024bgz, AT2024pvu and AT2024wsd were all thought to be "thermal" TDEs, exhibiting purely thermal blackbody radation. The other two (AT2020afhd & AT2019aalc) were thought to be "Bowen flouresence flares", exhibiting broad flourescence lines in addition to typical AGN spectra. These lines, very rare in AGN, might be from newly-launched jets, or from dense metal-rich gas accretion disc gas very close to the SMBH being ionised by transient EUV flares.
MOPTOP data showed the three thermal TDEs exhibited low polarisation levels (ΔP ~ 0-6%), implying the source was reprocessed light from the accretion disc centre. The observations were quite soon after the flare began, so the disc must have formed rapidly. This suggests the optical output from most thermal TDEs comes from reprocessed light from the already-formed accretion disk, rather than from the intersecting debris streams still in elliptical orbits earlier in the TDE timeline.
The two Bowen flares however showed a moderate amount of polarisation (ΔP ~ 0-8%) with the polarisation angle varying over time. In AT2020afhd, the angle rotated 83±8 degrees 150 days after peak brightness, implying a scattered light echo. With AT2019aalc the angle began swinging quasi-periodically by ~40 degrees 190 days after peak flare, implying a clumpy, asymmetric outflow and a tilted, precessing accretion disk. This might have been a partial TDE happening inside a pre-existing AGN gas-rich environment.
The authors conclude by stating the Vera Rubin Observatory's photometric survey, due to begin late 2025, will no doubt raise the annual TDE discovery rate from a few tens to a few thousand. Subsequent high-cadence followup polarimetry of this much larger dataset would let us know to a much greater statistical certainty how often TDE flares are caused by intersecting debris streams or reprocessed light from an established accretion disk.
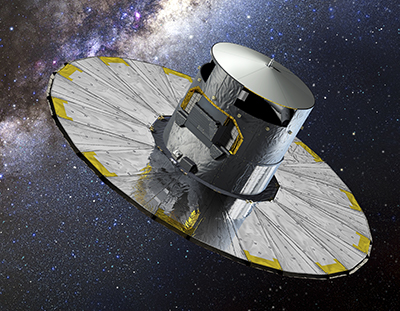
Artist's impression of Gaia. Image ©2013 ESA/D.Ducros
March 27th saw the European Space Agency (ESA) switch off the Gaia spacecraft, ending one chapter of a mission that continues to revolutionise our understanding of the Milky Way galaxy we live in.
Launched in 2013, Gaia was put into a Lissajous orbit around the Sun-Earth L2 Lagrange point, 1.5 million km from Earth. There it precisely mapped the positions, distances, velocities, and properties of nearly two billion stars and other celestial objects in our galaxy. It has provided us with the largest, most precise multi-dimensional map of our galaxy ever created, revealing the Milky Way's structure and evolution in unprecedented detail.
Gaia uncovered evidence of past galactic mergers, identified new star clusters, contributed to the discovery of exoplanets and black holes, mapped millions of quasars and galaxies, and tracked hundreds of thousands of asteroids and comets. It also enabled the creation of the best visualisation of how our galaxy might look to an outside observer.
These discoveries came in part due to Gaia's incredible precision. It measured stellar positions to the nearest five-hundred-millionth of a degree — like using a telescope in London to measure the width of a human hair in Rome.
The LT's role in the Gaia mission
This unprecedented level of precision depended in part on accurate tracking of Gaia itself. Its position needed to be known to the nearest 150 metres, and its velocity to 2.5 mm/s. ESA used a special radar technique for this, but could only use it on Gaia 1-2 times a month, so ESA turned to ground-based optical telescopes to fill the gaps in coverage. The Gaia Ground-Based Optical Tracking (GBOT) campaign utilised the VLT Survey Telescope (VST) at Paranal in Chile, and the Liverpool Telescope. The two Faulkes Telescopes in Hawaii and Australia provided backup whenever both VST and LT were offline at the same time.

Gaia track against background stars, LT IO:O data from 3 September 2015. ©2016 J.Marchant/LT Group
The LT is fully robotic. With no human intervention it decides for itself what to observe, drawing from a database of submitted requests from astronomers around the world. These requests can be dropped into the database at any time, so astronomers can spread out their allocated time throughout the semester any way they like. This unique flexibility for a professional telescope of this size made it perfect for tracking Gaia.
The LT took 20-40 exposures of Gaia for GBOT on every moonless night, using its workhorse imaging camera IO:O. The data was automatically processed the next morning and made available to GBOT staff at the Observatoire de Paris in France. Their pipeline automatically detected Gaia in the images, using a technique based on an idea provided by LT staff. Gaia's position was routinely measured to the 150 metre precision required for the mission — like measuring to the nearest millimetre from 10 kilometres away.

Gaia's trajectory relative to Earth from 1st March through June 2025. Part of original L2 orbit visible 1-27 March, followed by acceleration away from Earth after orbital manoeuvre. ©2025 J.Marchant using data from JPL Horizons System.
This coordinate data, plus that provided by the VST and Faulkes, allowed ESA's European Space Operations Centre (ESOC) in Darmstadt, Germany to calculate Gaia’s exact position and velocity in space. This ultimately helped to refine the Gaia catalogue’s amazing precision.
So far, three major catalogues or "Data Releases" have been made public. DR1 (Data Release 1) came out in 2016, DR2 in 2108, and DR3 in 2022, but more are to come — the Gaia spacecraft may be switched off but the Gaia mission is far from over. The huge amount of data generated is still being analysed and more discoveries are being made. The next Data Release, DR4, is scheduled for mid-2026. The final release, DR5, is expected in or around 2030.
Gaia itself is now drifting slowly and silently away from Earth space (see left). Before being switched off it was boosted out of halo orbit and is now moving around the Sun in an orbit a little larger and slower than the Earth's. Every ~14 years it will make a full circle relative to Earth and swing past our planet. By design, closest approach will be no closer than 10 million kilometres so that Gaia doesn't interfere with future space missions.

[Left] The primary mirror before realuminising, in its shipping box about to be sent to the aluminising plant. [Right] The primary mirror after realuminisation, in the mirror cell about to be refitted to the telescope. The difference in surface finish is notable. Images © 2024 Chris Mottram.
The LT was offline for three weeks recently (22 Aug to 13 Sep) for a major bout of scheduled maintenance.
Top of the long list of tasks was realuminising the 2-metre primary mirror using the nearby aluminising plant at the William Herschel Telescope (WHT) facility.
This is no small feat — the mirror would have to be hoisted out of the top of the enclosure through a narrow gap, and despite weighing 1.35 tonnes it can still be blown by the wind.
Despite a few hitches the procedure was successful. The mirror was carefully craned into its transporting box, and then onto a special mirror transport truck to go to the aluminising plant. Over the next two days WHT personnel cleaned and stripped the mirror, then evaporated a new layer of aluminium onto its surface. It was returned to the LT facility on 5th September.
Once the mirror and instruments were refitted, recommissioning could begin. The telescope was recollimated, the instruments realigned and recalibrated, and on 13th September routine science observations resumed.
The realuminising improved the primary's reflectivity by over 100% across the optical spectrum. This, plus cleaning of the science fold (tertiary) mirror, caused throughput to the workhorse imager IO:O to increase by nearly a magnitude in some bands.
Some of the other tasks performed over these three weeks included –
- improving the vacuum in IO:O's cryostat by vacuum pumping it while at room temperature
- performing maintenance on LIRIC's water cooling system
- replacing a motor, gearbox and encoder set for the cassegrain axis derotator
- prepping all components for the new weather mast, to be installed later this year
- reinstalling SkyCam Z – mirrors were cleaned, recollimated, and a new camera fitted
- two new enclosure hydraulic cylinders installed
- science fold (tertiary) mirror cleaned
Lead for this maintenance project, and present throughout, was LT Engineering Manager Stuart Bates. Also present at various times were Joao Da Silva Bento (NRT DevOps Engineer), Ali Ranjbar (NRT Mechanical Engineer), Adam Garner (NRT Control & Automation Engineer), Chris Mottram (LT DevOps Engineer) and Chloe Miossec (NRT Instrument Scientist). Robert Smith (LT Project Scientist) provided essential remote support during recommissioning.
Overall, the three-week event went well. The vast majority of maintenance tasks were completed successfully, ensuring the telescope will continue to provide time-domain and rapid-response reactive data for the astronomical community.
The Liverpool Telescope. ©2017 Daniel López/IAC
Twenty years ago, on 22 April 2004, a key milestone in the commissioning of the Liverpool Telescope was passed when control of the night was handed over to the LT's robotic scheduler for the first time.
The Liverpool Telescope was originally conceived in the 1990s as a joint venture between Liverpool John Moores University and the Royal Greenwich Observatory. The telescope was constructed on Merseyside in the UK by Telescope Technologies Ltd., a spin-off company of the university. First light for the telescope was achieved in the summer of 2003, but as any user of the telescope will know the key capability of the telescope is its robotic control system, enabling rapid and flexible observations of the time variable sky. The beginning of robotic observing then is really the birth of science operations at the telescope. Present at the observatory in 2004 were LT staff Iain Steele and Steve Fraser, and they described the first robotic run as "overall very pleasing".
In the 20 years since, LT data has contributed to over 1060 peer reviewed publications, and via The Schools Observatory over 200,000 telescope observations have been obtained for thousands of schools across the UK, Ireland and Spain. Despite the age of the facility the future of the Liverpool Telescope is bright: it is one of the world's leading facilities for transient classification, and continues to deliver important, time critical observations across a range of observing programmes. 2024 is a big year for the telescope: we have already seen the successful commissioning of LIRIC, the LT's newest instrument, and major engineering works are planned through the summer which will see the replacement of the encoder systems on all three axes, replacement of the hydraulic rams which drive the opening and closing of the enclosure, and realuminising of the telescope mirrors. These works will ensure the reliability and productivity of the telescope for years to come.
 NRT in clamshell enclosure; latest June 2023 render by NRT Structural Engineer Luka Gradišar.
The New Robotic Telescope (NRT) team welcomed two new members of staff this month. Dr Chloé Miossec joins from the University of Liverpool full-time as Instrument Scientist, and Dr Richard Ashley joins part-time from the Isaac Newton Group of Telescopes as Visiting Research Fellow.
Both Chloé and Richard will be building on the work started by previous NRT instrumentation scientist Dr Éamonn Harvey. They will develop the first-light instrumentation that will deliver the core science goals of the telescope.
Meanwhile Professor Iain Steele, the overall head of the ARI Technology Group that encompasses both NRT and LT, will now be devoting all of his time to ensuring the successful delivery of the NRT project.
Dr Chris Copperwheat is stepping into the role of Director of the Liverpool Telescope to lead the daily running of the facility.
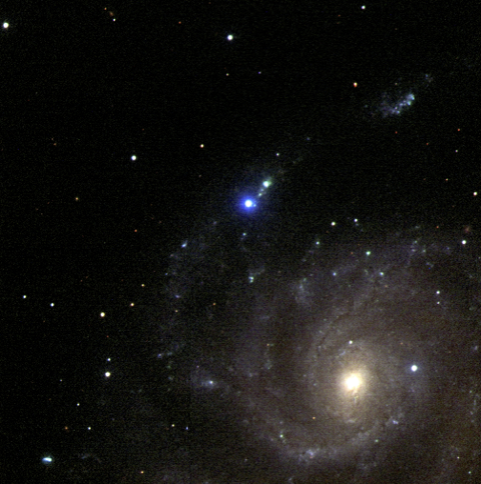
False colour image of supernova SN 2023ixf (bright blue object near centre of frame), made with LT IO:O data taken early in the event. ©2023 Robert Smith, LT Group
One of the closest supernovae in the last decade appeared in our skies a couple of weeks ago. Supernova SN2023ixf was first detected on 19th May in the Pinwheel Galaxy (M101) by amateur astronomer Koichi Itagaki.
Within hours of Itagaki's announcement, LJMU ARI astronomer Dr Dan Perley was able to officially classify the object as a type II supernova, thanks to the LT's flexible scheduling capabilities and instrumentation.
Public access observing campaign
An aggressive 3-month campaign of daily (at first) multi-band LT imaging and spectroscopy is now under way, to follow the evolution of the supernova for as long as it is visible. The observations consist of both IO:O imaging (to follow the color, temperature, and luminosity evolution) and SPRAT spectroscopy (to measure the evolution of velocities and line widths).
In addition, and as a first for the LT, all data is being released to the public immediately. Normally LT data remains proprietary to the investigating team for a year after acquisition.
Dan Perley, the principal investigator of the project, said this move was to avoid the potentially excessive number of requests for followup observations of the same target, which would reduce the efficiency of the LT's adaptive robotic scheduler.
Download your data
The latest SN2023ixf public data can be downloaded right now from the LT's archive of data taken in the last two weeks, at SN2023ixf Recent Data. Use these credentials: username "PQ23A01" and password code "5221533".
Data more than two weeks old can be found with the help of the general Data Archive online form. On the other hand, brand new data arriving overnight can be viewed on the Quicklook page. Data appears here about 5 mins after the shutter closes. It will be reduced with the latest calibration flats the following morning, and exists here just for "quick look" purposes only. It can be accessed with the same credentials as above.
Please note: anyone employing these data in forthcoming circulars or publications are requested to cite the AstroNote where the public announcement was made. Publications should also include the relevant telescope and instrument acknowledgments and citations as set out in our Acknowledgements page.
Legacy
The supernova is only 21 million light years away, so is one of the closest to date. Because it was first observed while still rising to peak brightness, and due to its favourable sky location, it will be one of the best-observed cosmic explosions of all time.
Dr Perley added: "It shares a host galaxy with the famous SN 2011fe and extensive pre-explosion observations are available from HST and other major facilities. It may be the most important core-collapse supernova of the 21st century so far."

Artist's impression of FBOT AT2018cow.
Image ©2023 Philip Drury, University of Sheffield.
(adapted from press release)
An explosion the size of our solar system has baffled scientists, because part of its shape — similar to that of an extremely flat disc — challenges everything we know about explosions in space.
The explosion was a bright Fast Blue Optical Transient (FBOT) — an extremely rare class of explosion which is much less common than other explosions such as supernovas. The first bright FBOT was discovered in 2018 and given the nickname “the cow”.
Explosions of stars in the universe are almost always spherical in shape, as the stars themselves are spherical. However, this explosion, which occurred 180 million light years away, is the most aspherical ever seen in space, with a shape like a disc emerging a few days after the initial burst was discovered. This section of the explosion may have come from material shed by the star just before it exploded.
It’s still unclear how bright FBOT explosions occur, but it’s hoped that this observation, published in Monthly Notices of the Royal Astronomical Society, will bring us closer to understanding them.
Dr Justyn Maund, lead author of the study from the University of Sheffield’s Department of Physics and Astronomy, said: “Very little is known about FBOT explosions — they just don’t behave like exploding stars should, they are too bright and they evolve too quickly. Put simply, they are weird, and this new observation makes them even weirder. Hopefully this new finding will help us shed a bit more light on them — we never thought that explosions could be this aspherical."
He went on to say that there are a few potential explanations for the flatness of the explosion. One is that the star involved in the blast may have created an equatorial disc just before it went supernova. Another explanation could be that as the star tried to go supernova the core collapsed to a black hole or neutron star, which the rest of the star fell into.
Maund added: "The levels of asymmetry recorded are a key part of understanding these mysterious explosions, and it challenges our preconceptions of how stars might explode in the Universe.”
Maund and his team used the LT's MOPTOP polarimeter to measure the polarisation of the blast, which in turn allowed them to deduce the shape of the explosion — effectively seeing something the size of our Solar System but in a galaxy 180 million light years away. They were then able to use the data to reconstruct the 3D shape of the explosion, and were able to map the edges of the blast, allowing them to see just how flat it was.
The LT's primary mirror is 2.0m in diameter, but by studying the polarisation the astronomers were able to reconstruct the shape of the explosion as if the telescope had a diameter of about 600km.
Researchers will now undertake a new survey with the international Vera Rubin Observatory in Chile, which is expected to help discover more FBOTs and further understand them.
Why "cow"?
The nickname comes from the FBOT's designation "AT2018cow". Transients are assigned a letter of the alphabet as a suffix, introducing a second character when the number of transients goes above 26 ("z"), and a third when above 676 ("zz"). The "c", "o", "w" suffix, which just happens to spell out a real word, indicates this was the 2441st transient observed that year.

Artist's impression of bright GRB 221009A.
Image ©2023 Soheb Mandhai, University of Manchester.
Last October, astronomers witnessed the brightest gamma-ray burst ever seen by human instruments. A recent paper by Tanmoy Laskar et al ("The Radio to GeV Afterglow of GRB 221009A"), recently published in the Astrophysical Journal Letters as part of a special issue on this remarkable cosmic event, describes how the evolution of the fireball was tracked by an international group of astronomers and observatories, including the LT.
Gamma ray bursts (GRBs) are short intense bursts of gamma rays that appear to emanate from distant pointlike sources in the universe. They only last a few seconds to a few minutes, but are accompanied by longer afterglows in lower energy bands, from Xrays through UV and optical down to infrared, millimetre and radio waves.
Two types of GRBs are known, short and long, referring to the duration of the burst. Long GRBs, the subject of this paper, last up to a few minutes. It's thought that they happen when an accreting black hole or magnetar forms during a supernova. Matter is beamed at relativistic speeds out of the poles of the spinning black hole or magnetar, forming a jet that impacts the ambient gas that already existed outside of the star before it went supernova. The impact creates a "forward shock" in the gas that excites the electrons in the gas to extreme levels causing them to emit electromagnetic radiation, in a wide range of wavelengths, in a focused beam along the direction of travel of the jet.
This GRB was observed to explode on 9th October 2022 and was the brightest gamma-ray burst ever detected. Dr Dan Perley, one of the paper's authors, said the GRB was "quite possibly the brightest burst seen from Earth for the past 10,000 years". It's thought it was this bright because it was not only relatively close, but the jet axis, and so the beam of electromagnetic radiation, happened to be pointing almost right at Earth. The LT was one of the first optical telescopes to observe it from the ground, and was able to continue to follow it for more than a month as the radiation faded.
The paper describes in detail how the LT data was combined with data from other facilities (e.g. VLA, ALMA, Swift) to study the physics of the afterglow radiation.
Other GRB-related articles in the News Archive:
- LT catches its first Gamma Ray Burst
- Liverpool Telescope nails exploding star
- LT Unravels Mystery of Cosmic Blasts
- RINGO Wins Times Higher Education Supplement "Research Project of the Year" Award
- LT Detects 10% Optical Polarisation in Gamma-Ray Burst
- Liverpool Telescope Reveals Supernova Associated With New Type of Gamma-Ray Burst
- RINGO2 Used to Probe Early Evolution of Gamma Ray Bursts
- Rapid-response monitoring of a "nearby monster"
- A Milestone Gamma Ray Burst Study: GRB190114C

Artist's impression of the accretion disc surrounding the supermassive black hole at the centre of an active galactic nucleus. Image © 2008 NASA/Goddard Space Flight Center Conceptual Image Lab.
A recent paper by Ian McHardy et al reveals insights into the structure of the accretion disc surrounding the supermassive black hole at the centre of the active nucleus (AGN) of galaxy NGC 4395.
It's long been known that most galaxies harbour supermassive black holes (SMBHs) at their centres. Surrounding the black holes in some galaxies, known as Active Galaxies, are accretion disks of hot gas spiralling in to disappear beyond the event horizon at the disk's centre. In the very inner parts, immediately surrounding the black hole, is an intensely hot region emitting X-rays.
Most of the X-rays escape and can be directly observed by space observatories. However a significant fraction of the X-rays spread out across the disc itself. These X-rays interact with the matter there and are re-emitted in a wide range of energies. The X-rays are "reprocessed" into UV light near to the SMBH, and into optical wavelengths of decreasing energy the further out in the disc you go, as the disc is cooler further out.
Still further out lies an inflated region of gas. The high energy photons from the central X-ray and UV emitting regions excite the atoms in the gas causing them to re-emit both optical emission lines and optical continuum emission. The rapid motion of this gas broadens the emission lines by the Doppler effect, giving rise to the term "Broad Line Region" (BLR) for this region around the accretion disc.
Still further out lies a toroidal region where temperatures are low enough for dust to form.
Determining the geometry of the inner regions of AGN has long been a major aim in high energy astrophysics. However the structure of the whole system cannot be imaged directly because for even the closest AGN and the largest telescopes, the disc and BLR subtend too small an angle to resolve. All we see, from a combination of the X-ray emission plus the UV/optical emission from the accretion disc, and the broad line emission from the BLR, is just a point source.

Artist's impression of reverberation mapping; variations in flux at the inner part of the disk are seen from Earth both as direct rays and as light echoes ("reverberations") off material further out in the accretion disk. Image © 2023 J. Marchant.
One technique that is used to gain an insight into the disc and BLR structure is called "reverberation mapping". Because the UV, optical and line emissions are driven by the X-ray flux, any natural variations in the latter are mimiced by the former — but crucially, only after time delays due to the light travel times across the disc.
Assuming the time lags between X-ray variations and the echoed variations further out are due solely to the light travel time, the lags can be used to calculate the distance to the matter causing the time-lagged emissions and hence to 'map' the size of the broad line region.
There are reasons to believe that the inner structures, particularly that of the disc, might change with changing mass of the black hole. Although there have been some reverberation studies of higher mass AGN, there has been no serious study of a very low mass AGN, largely because most of them are very faint. McHardy's paper describes reverberation mapping observations of the very low mass AGN at the centre of galaxy NGC 4395, made with both the Liverpool Telescope (LT) and the Gran Telescopio Canarias (GTC).
In "First detection of the outer edge of an AGN accretion disc: Very fast multiband optical variability of NGC 4395 with GTC/HiPERCAM and LT/IO:O" (McHardy et al, MNRAS, 2023), the team first describe multiband reverberation mapping observations with the LT's IO:O instrument. Although they did not have access to simultaneous X-ray satellite observations, they were able to look for variations in a number of separate optical wavebands, which would reveal signs of the varying light from central X-ray variations sweeping across the disc.
The observation they set up repeatedly cycled through IO:O's set of Sloan Digital Sky Survey (SDSS) filters. They found strong, rapid and very well correlated variability, with the longer wavelengths lagging behind the shorter wavelengths as expected from reverberation. The cadence between each complete set of filters was not quite fast enough to remove uncertainties in the lag timing and hence properly tie down the wavength-dependent lags, but as a proof-of-concept, the LT data was fundamental in getting the project off the ground and demonstrating feasibility.
On the strength of the LT data, the team were then able to secure telescope time to repeat the observations on the GTC. Its Hipercam instrument's much faster cadence afforded the finest yet sampling of AGN reverberation time lags across multiple filter bands.
The main observational conclusion was that, although there was a large lag between the u and g bands, the lags between u and the longer wavelength r, i and z bands did not increase very much with increasing wavelength. The centroid of the emission region was not moving much further away from the black hole as it moved to longer wavelengths. One of the many conclusions reached in the paper therefore was that the accretion disc had to be "truncated", i.e. its outer edge appeared to be "missing".
The authors propose that the outer edge of the accretion disc is actually not "missing" as such, but rather obscured from view by something resembling a wall. They suggest that this wall might be a wind rising up from the disc, obscuring near to the disc either due to a high gas density or the presence of dust within the wind. The authors show that the wall is at about the same distance from the black hole as is the inner edge of the BLR and so, higher up from the disc, the wind might actually become the BLR.
This is the first observation of a truncated AGN accretion disc, and the discovery has implications for future research in reverberation mapping.

Launch of Artemis 1 mission early on 16th November 2022. Credit: NASA/Joel Kowsky.
Sequence of twenty images by the Liverpool Telescope's IO:O imager showing the motion of the Orion capsule against the background stars on the morning of 17th November 2022. Left: images arranged as an animation. Right: the same images stacked. Credit: Liverpool Telescope group.
The United States' National Aeronautics and Space Administration (NASA) began its Artemis program with the launch of the "Artemis 1" mission on Wednesday. Artemis 1 is the first crew-capable deep-space mission since Apollo 17 in 1972, and marks the beginning of humans returning to the Moon after a gap of 50 years.
In the first of a series of increasingly complex Artemis missions, Artemis 1 should see the uncrewed (for this mission) Orion spacecraft spend over three weeks in space, including over five days orbiting the Moon, before returning to splash down in the Pacific Ocean on 11th December. The whole mission should last about 25 days.
Artemis 1 is the first mission of the Artemis program, which aims to return astronauts to the Moon by 2024. It will use innovative technologies to explore more of the lunar surface than ever before, and in collaboration with commercial and international partners, establish the first sustainable long-term human presence on the Moon. The experience gained will lay the groundwork for the Artemis programme's long-term goal of sending humans to Mars.
Of the many Artemis missions planned over the next ten years, Artemis 2 (scheduled for May 2024) will see Orion make basically the same flight as Artemis 1 but with crew on board. The first lunar landing of the Artemis program will be on Artemis 3 (2025), which should see crew in lunar orbit transferring from Orion over to SpaceX's Starship Human Landing System (HLS) spacecraft to go on to make a landing on the Moon.
Artemis 1 began at 06:47 UT on 16th November with the launch of NASA's Space Launch System (SLS) rocket, more powerful than the Saturn V that sent Apollo to the Moon. Less than two hours later the SLS' upper stage boosted Orion out of low Earth orbit to begin first leg of its journey, a translunar trajectory to the Moon.
Twenty-two hours later, on 17th November, Orion was some 185,000 km from the Earth and above the Liverpool Telescope's horizon. Using the LT's workhorse optical camera IO:O, a sequence of images was obtained between 06:40 and 06:50 UT (see right) that show Orion moving almost directly away from the Earth at 1.4 kilometres per second.
North is at top in the images, and the spacecraft's motion is from top to bottom along the track. Each image is a ten second exposure every ~30 seconds. Orion was still close enough to the LT that the Earth's rotation caused the track to curve slightly to the west — the LT moved eastwards by 250km during the imaging sequence.

LT MOPTOP image of the Moon during total lunar eclipse on 16th May 2022. ©2022 Iain Steele, Klaas Wiersema.
Observations of the Moon in polarised light have been made by the Liverpool Telescope during a recent total lunar eclipse, as reported in a paper just published in Monthly Notices of the Royal Astronomical Society.
Total lunar eclipses occur when the Moon passes completely into the Earth's shadow and all direct light from the Sun is blocked. The bright full Moon dramatically fades, but still remains slightly visible due to indirect light refracting through the Earth's atmosphere (see diagram below).
As this light passes through the atmosphere it undergoes innumerable scattering events off air molecules. This removes all but the red part of the sunlight, which then goes on to dimly illuminate the Moon. This is why the Moon appears red (as well as faint) during a total lunar eclipse.
However, another effect of this scattering is that the red light also becomes slightly polarised, which can be detected through polarimetry. Polarimetry is the measurement of the angle of the vibrations of a light wave – normal light contains a mixture of light with all different angles, and so appears unpolarized. But when light is scattered multiple times, it will become polarized. This is how Polaroid sunglasses help you see better on a hazy day.

Lunar eclipse diagram.
Image credit: Shayanne Gal / Business Insider
The most recent lunar eclipse was on 16th May 2022 and was observed using a polarimeter at the Liverpool Telescope. The measurement used the LT's new "MOPTOP" polarimeter to show that the reflected light from the Moon was polarized by up to 2 percent. Only three previous successful measurements (in 1968, 2014 and 2015) of this phenomena have ever been made before.
The polarization measured was in the middle of the previous values found. MOPTOP also measured the colour of the Moon during the eclipse, and found it also to be at the middle of the range from previous eclipses. Combining this information together this is strong evidence that the degree of polarization changes from eclipse to eclipse, and must be related to the amount of dust and clouds high in the Earth’s atmosphere on that particular day.
As well as being important in its own right, this information also helps astronomers planning to use polarimetry to observe exoplanets transiting their host stars.
If polarization signals could be found, it would allow us to infer the presence and distribution of clouds in the exoplanet's atmosphere.
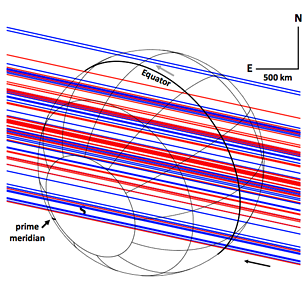
Geometry of the 5 October 2017 occultation by Triton. The 90 red and blue lines are "occultation chords", trajectories of the background star relative to Triton, as observed by 90 telescopes across Europe and north East USA. The blue chords produced light curves that had sufficient signal-to-noise ratio to be included in a global atmospheric fit. Image from Figure 5 of the paper described in the text.
A recent paper by J. Marques Oliveira characterises the structure of the atmosphere of Neptune's largest moon Triton in greater detail than before.
In "Constraints on the structure and evolution of Triton’s atmosphere from the 5 October 2017 stellar occultation and previous observations" (Oliveira, Sicardy et al, Astronomy & Astrophysics, Vol. 659, Article A136, March 2022), the authors primarily discuss the occultation of a 12.7-magnitude star by Triton.
Stellar occultations by foreground planets and/or moons can reveal details about the atmosphere of the occulting body. Instead of disappearing suddenly behind Triton at ingress, the background star dimmed more slowly as the increasingly dense layers of Triton's atmosphere moved in front of it. The light curves at both ingress and egress effectively probed the atmospheric layers at those two points above Triton's surface.
As seen from the Earth, Triton passed in front of the star Gaia EDR3 2610107911326516992 (hereafter "G26") just before midnight on 5th October 2017. It cast a shadow that sped across Europe, NW Africa and eastern USA at ~20km/s. More than 100 observatories in the shadow's path attempted to observe the occultation. Ninety light curves were produced, of which three (one from the LT's RISE fast-readout camera) had the best signal-to-noise ratio and were used for determining a detailed model of the atmosphere's density, pressure and temperature. They found a slight negative temperature gradient below ~30km altitude, implying a mesosphere just above an expected stratosphere, with a positive temperature gradient connecting the atmosphere to the cold surface.
Adding the next best 49 light curves enabled the creation of a synthetic and smoothed model of the density, pressure and temperature profiles, from an altitude of 47km down to the surface.

Occultation lightcurve taken with the LT's RISE fast-readout camera. Image from Figure 6 of the paper.
There have now been five occultation measurements of Triton's atmosphere, the first being in 1989 obtained by observing Voyager 2's radio signals as it passed behind the moon. A survey of all five measurements show that a transient pressure increase reported from a single chord transit in 1989 (and absent in the authors' 2017 data) was probably real, but remains debatable. This is due to the scarcity of high SNR light curves, and the lack of a fully consistent analysis of the best data sets used by other teams. The authors also explored a volatile transport model (VTM) by another author and found it supported only a modest increase of surface pressure over the same time period.
This VTM also concludes that for the pressure increase to be both weak and then absent by 2017, there must be N2 present between the equator and latitude 30°S, and a north polar cap extending as far south as 45°N.
Near the centre line of the shadow path, 42 observatories in northern Italy, the south of France, and central Spain observed a flash at mid-occultation as light from G26 refracted around Triton's atmosphere. Twenty-three of the light curves had a high enough signal-to-noise ratio to enable measurements that showed the atmosphere is spherical, with only a slight possibility of gravity waves. This implies that it's unlikely there are any supersonic winds in Triton's atmosphere.
Further work based on the occultation data will investigate these gravity waves, as well as the possible presence of haze layers and of a troposphere just above Triton's surface.

The Liverpool Telescope, March 2022. Image ©2022 Iain Steele.
Summary
- Many long overdue mechanical, hydraulic, pneumatic and electrical maintenance tasks, to ensure continued reliability.
- Horizon limit lowered from 35° to 26° elevation
- Mirrors cleaned, increasing zeropoint by 0.5 magnitudes
- New photometric shutter reduces minimum recommended integration with IO:O from 20s to 0.01s
Due to travel restrictions imposed by a global pandemic and a volcano on La Palma, it had been two years since the last maintenance trip from Liverpool to the LT. Fortunately due to the remote efforts of LT staff and on-site support by Dirk Raback, the telescope continued to observe over that time.
By early this year a large list of things to do had nonetheless built up and a maintenance trip was very welcome. Travel restrictions eased in March, and on the 10th telescope director Iain Steele and engineering manager Stuart Bates flew to La Palma for two weeks to address the most pressing items.
Part of the telescope's altitude axis encoder tape had become contaminated with "calima" dust from the Sahara, preventing observations below an altitude of 35°. This tape was cleaned, restoring observations down to 26° altitude.
The telescope focuses by adjusting the position of the secondary mirror, and the machine control system that governs this needed replacing. This wasn't a simple task as it sits inside the secondary mirror enclosure at the top of the telescope. By erecting scaffolding inside the enclosure and tilting the telescope down to meet it, the control unit was replaced.

Primary mirror being cleaned by Stuart Bates.
Image © 2022 Iain Steele.
Over two years the primary mirror had built up a coating of calima that reduced reflectivity to 55%. It wasn't possible to strip and recoat the mirror with a fresh layer of aluminium, so it was washed instead. "Washing" actually consisted of very carefully dabbing the surface with cotton wool soaked with a cleaning solution.
The Acquisition and Guidance ("A&G") box, the structure that the instruments are mounted on, had been removed along with the instruments in anticipation of removing the primary mirror for cleaning. However a cold snap at the mountaintop meant the roads were too icy for the crane to drive up from sea level, so the mirror had to be cleaned in-situ. This made the task more difficult but not impossible. It took two days, but reflectivity was increased to 76%. While the A&G box was off the telescope, the science fold (tertiary) mirror was also cleaned, improving its reflectivity from 63% to 83%.
IO:O's iris shutter was replaced with a travelling-curtain shutter. As well as providing more even illumination for short exposures, integration times as small as 1 millisecond are now possible (10ms recommended for photometry). This means targets much brighter than before are now potentially observable with IO:O. MOPTOP's cameras were replaced with more robust models that should cope better with the dusty calima environment.
There are more maintenance tasks to do, and they will be addressed in future site visits through the year.

Artist's impression of JWST.
Credit: NASA GSFC/CIL/Adriana Manrique Gutierrez
This article adapted from the JWST item on the New Robotic Telescope site.
It's well-known that the LT is designed to observe transient natural sidereal phenomena (e.g. supernovae, gamma-ray bursts, optical counterparts of gravity wave events) and non-sidereal targets (near-Earth asteroids and comets). However, it can also track some artificial satellites and spacecraft too, one example being the Gaia space observatory. Since its launch in 2013, Gaia has been tracked by the LT to monitor its position accurately in its halo orbit about a special position in space known as the second Sun-Earth Lagrange point (L2).
This position is one of five Lagrange points in the Sun-Earth co-rotating orbital plane where the gravitational forces of both bodies balance each other. A spacecraft placed at any of them needs very little orbit correction fuel to maintain its position relative to Earth. L2 lies ~1.5 million kilometres "behind" the Earth as seen from the Sun, about four times further away than the Moon. That area is becoming an increasingly-preferred location for space observatories. From L2 (or a halo orbit around it) both Earth and Sun appear close together, so it's much easier to thermally shield temperature-sensitive telescopes from both bodies.
A few weeks ago one of the most exciting telescope-related events of 2021 was the launch of the James Webb Space Telescope (JWST). It began its journey with an accurate launch into L2 transfer orbit at 12:20UT on 25th December 2021, and was observed by the LT that night. By then JWST was 139,000km above the Atlantic Ocean, and still moving at over 2.1 km/s relative to the Earth's centre.
 Top: The JWST is the streak near the centre of this 60-second LT image taken early 26th December 2021. Bottom: Animation of ten 10-second LT images of JWST, taken on 11th January 2022. See text for more details of both images. Credit: LJMU/LT/J.Marchant
The LT imaged JWST again on 11th January 2022 in a sequence of ten 10-second images. By then it was 1.14 million kilometres away and considerably slower, moving at just ~300 metres/second. Both image sets featured here were taken using the LT's IO:O instrument, the facility's main workhorse imager.
JWST is a revolutionary telescope, and astronomers and engineers across the world have waited patiently for its completion and launch for many years. Because they're located outside Earth's atmosphere, space observatories like the Hubble Space Telescope (HST) and JWST avoid the filtering and turbulent effects of the atmosphere and obtain the best view of the Universe for a telescope of that size.
The HST with its 2.4-metre primary mirror has provided astronomers with incredibly deep images of distant galaxies, but JWST will have a 6.5 metre mirror, capable of catching more photons and therefore probing even further into the depths of our Universe.
The JWST will look back over 13.5 billion years at our Universe in optical and infrared wavelengths and explore the formation of the first stars and galaxies. As JWST is designed to allow for measurements at infrared wavelengths, it is perfectly primed to see through the dust enshrouding many objects in the Universe such as stars and planetary systems. JWST will also explore distant exoplanet systems and objects within our own Solar System.
At time of writing, JWST has successfully deployed its sunshield and primary mirror, and is on course for starting its manoeuvre on 23rd January to enter L2 halo orbit. This rocket burn corrects any residual trajectory errors and adjusts the final L2 orbit. Due mainly to the accuracy of the launch however, less propellant will be needed for midcourse corrections than expected. The extra fuel remaining can therefore be used for stationkeeping and momentum management/attitude control instead, effectively extending JWST's stay at L2 from its original estimate of maybe 10 years to perhaps as much as 20 years.

Hubble Space Telescope image of the star WR 124, surrounded by hot clumps of its own outer atmosphere ejected into space by fierce stellar winds over the last ten thousand years. This star is similar to those which created the supernovae SN 2021csp and SN 2019hgp mentioned in the text. Credits: original image ©1998 NASA/ESA, reprocessed version ©2015 Judy Schmidt.
Liverpool Telescope observations have helped to unveil a previously unknown class of cosmic explosion.
Exactly what happens to the most massive stars at the end of their lives has long been mysterious. From observations of stellar populations within our own Milky Way galaxy and its neighbours, we know that many such stars lose their outer hydrogen layers to become Wolf-Rayet stars — very hot and luminous stars that are rapidly shedding material into space in high-velocity winds. Some models predict that such stars should eventually collapse to form black holes, but observational evidence of this has so far been lacking.
In work recently published in Nature and soon to be published in the Astrophysical Journal [preprint], a team of astronomers used the Liverpool Telescope (LT) alongside other facilities worldwide to identify a new class of supernova — dubbed type "Icn" — that may reveal this transition.
The first such event (known as SN 2019hgp) was discovered in 2019 by the Zwicky Transient Facility (ZTF), a survey telescope in California. LT astronomers were able to obtain follow-up imaging observations (with IO:O) and spectroscopy (with SPRAT) within a day of discovery, giving crucial insight into the early phases of the explosion. The spectrum of the supernova was dominated by narrow lines of highly-excited carbon, oxygen, and neon — a combination never seen before in any cosmic transient. The properties of these lines suggested that material ejected at high velocities by a dying star had slammed into a dense sphere of carbon and oxygen rich material, much as one would expect from the explosion of a Wolf-Rayet star. The study of this event has recently been published in Nature by a team led by Avishay Gal-Yam, a scientist at the Weizmann Institute for Science in Israel.
The second event (known as SN 2021csp) was discovered in February 2021, also by ZTF. The Liverpool Telescope was the first facility on the scene after discovery, again acquiring SPRAT and IO:O observations that showed a fast and luminous supernova with strong, narrow carbon and oxygen lines — much like in SN 2019hgp. This provided the impetus for an LJMU-led team to quickly obtain crucial ultraviolet observations from the Hubble Space Telescope before the source faded away, providing even stronger evidence in favor of a Wolf-Rayet like progenitor. Additionally, continued observations from the Nordic Optical Telescope (one of the Liverpool Telescope's "neighbours" on the island of La Palma) showed the explosion to fade away almost to nothing within just two months — quite unlike normal supernovae, which take years to fade. The team interpreted this as evidence that most of the star's mass had collapsed into a black hole, rather than being ejected into space. This study was led by Daniel Perley, a staff member at LJMU's Astrophysics Research Institute, and has recently been accepted by the Astrophysical Journal [preprint].
Together, these two events suggest a new scenario for the fates of the most massive stars: they may produce a special kind of fast and fleeting supernova dominated by interaction between a small amount of material ejected outward early in the collapse and the pre-existing Wolf-Rayet stellar wind.
Type Icn supernovae are rare events and cannot on their own represent the deaths of all Wolf-Rayet stars. However, luminous events like SN 2019hgp and SN 2021csp may be just the tip of the iceberg: "If a similar explosion occurred, but the material was expelled more slowly or if the Wolf-Rayet wind was weaker, we would never know it even happened," points out Dr Perley.
Future, more sensitive surveys — such as with the upcoming Vera Rubin Observatory coupled to follow-up facilities like the New Robotic Telescope — will have a chance of unveiling such "hidden" transients in the coming years.
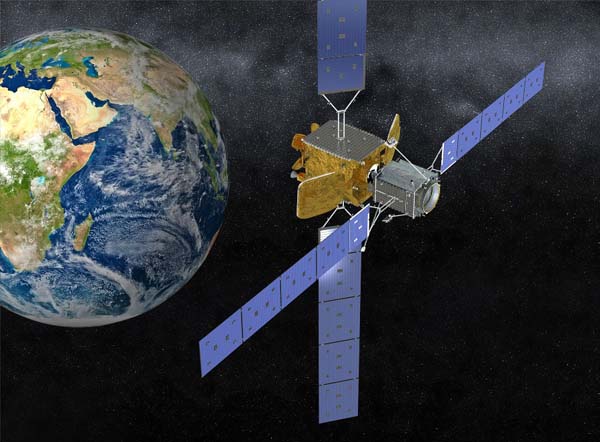
Artist's impression of MEV-1 (silver satellite at right) docked with Intelsat-901 (gold satellite). Credit: Northrop Grumman / Space Logistics.
For the first time, remote-controlled spacecraft have begun servicing communications and Earth observation satellites in geostationary orbit to extend the amount of time they can remain in service.
Geostationary Earth Orbit (GEO), a circular equatorial orbit at an altitude of 35,786km, allows a satellite placed there to remain apparently fixed over a point on the Earth's surface. Being very useful for communications, navigation and Earth observation, this orbit has become home to hundreds of satellites from many nations over the decades. These "GEOsats" use onboard propellant for attitude control and to maintain their exact position in orbit ("stationkeeping"). Over the years this fuel runs out, and so using the last dregs, the otherwise still-functional satellite is consigned to a "graveyard orbit" some 300km higher than GEO, where it is switched off.
In recent years however it has become feasible to start sending servicing spacecraft to rendezvous with near-empty GEOsats, and perform on-orbit servicing and mission extension activities, such as taking over stationkeeping duties. Many companies are now beginning to offer these services.
The first of these companies to launch a servicing mission was SpaceLogistics, a wholly-owned subsidiary of Northrop Grumman. It began operating its Mission Extension Vehicle (MEV) fleet of commercial on-orbit servicing spacecraft in 2019-2020.
Once launched into an initial elliptical orbit, a MEV would spend months using its electric propulsion system near-continuously to raise and circularise its orbit to match that of its target client satellite. After some time in rendezvous and proximity operations (RPO), a MEV would use telerobotics to dock with the satellite. It would then use its own propulsion system to take over manoeuvering and attitude control duties, extending the satellite's functional lifetime for however long the client wished. The MEVs have enough fuel to service several satellites in this way, and can move from one satellite to another as and when client contracts dictate.
The first two missions were monitored by a coalition of optical and radio ground-based facilities. Tasks included determining MEV/client detection and tracking capabilities, and maintaining continuous coverage by autonomously networking time-critical information between observing stations.
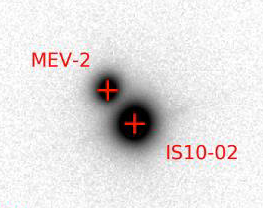
IO:O image of MEV-2 and Intelsat 10-02, 1.5km apart, during approach and docking.
Credit: LJMU, UoL.
The first MEV mission in 2019-2020 saw "MEV-1" return Intelsat 901 back to active service. This satellite had been dormant for some time in graveyard orbit. MEV-1 repositioned Intelsat 901 back into geostationary orbit, where it will remain in service for several years until completion of contract. MEV-1 will then put it back where it came from and move on to the next client. Lessons learned during observations of this mission were applied to those of the "MEV-2" mission in 2020-2021.
The MEV-2 mission saw the first servicing of an active satellite in GEO, Intelsat 10-02. MEV-2's orbit-raising manoeuvres to GEO were followed closely by the coalition, which for this mission included the LT using its IO:O hi-res camera. The LT became involved through a request from the University of Liverpool (UoL) who had been involved with the coalition for some time. IO:O also provided imagery for the RPO phase of the mission, where MEV-2 circled Intelsat 10-02 at close quarters and then docked. Observations by the LT and others in the coalition also proved that during RPO the two satellites could still be separated in the data using spectroscopy and polarimetry.
These observations are described in detail in a recent paper by George, S., et al: "PHANTOM ECHOES 2: A Five-Eyes SDA Experiment on GEO Proximity Operations", Proceedings of Advanced Maui Optical and Space Surveillance Technologies Conference (AMOS) Conference 2021 [download paper].
At the same time, a separate team used the LT's MOPTOP polarimeter to also observe the spacecraft in polarised light, both before and after docking. The team, led by Klaas Wiersema and Paul Chote of University of Warwick Astronomy and Astrophysics Group found the two spacecraft could be well separated in the data. Observations continued for several weeks after docking so that the polarimetric signature of the "combined stack" could be compared to those of the separate spacecraft previously.
Their data shows the polarisation of MEV-2 and Intelsat 10-02 does indeed differ after docking. The team will now compare the measured polarisation values as a function of viewing angle, with detailed numerical models of the reflection off the flat solar panels and main body. Comparing them to the known orientation of the satellites will determine if polarisation observations can indeed provide independent measurements of spacecraft orientations.
Useful Links
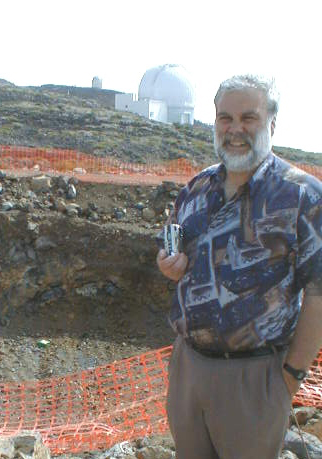 Dave Carter at the LT construction site around 2001.
We are sad to report the death over the weekend of our friend and colleague Professor David Carter. Dave obtained his PhD from the Institute of Astronomy, Cambridge in 1977 working on the surface brightness profiles of galaxies. He subsequently worked at the University of Oxford and the Anglo-Australian, Mount Stromlo and Siding Spring Observatories, before moving on to the Isaac Newton Group on La Palma and at RGO Cambridge where he combined his research with involvement in cutting edge instrumentation.
Dave joined LJMU in 1996 as Project Scientist for the Liverpool Telescope and his determined efforts played a large part in keeping the project on track during a difficult construction phase. He was an outstanding scientist who always took a constructively sceptical approach to the prevailing consensus, and an excellent mentor to younger colleagues and students. He was also a keen cricketer!
Dave took early retirement from LJMU in 2012 but continued to work on the major HST/ACS Coma Cluster survey he established as well as being a regular participant in group seminars and journal clubs. This also gave him the opportunity to step up his work at the Neston Methodist Church and Community Centre and become a local parish councillor. Dave was a great family man, and we send our condolences to his wife and three sons at this difficult time. He will be sadly missed by all.

A scene from the site tour, featuring navigation icons, the site annexe/workshop on the left, and the telescope enclosure on the right. Click the image to go to the Site Tour page.
A virtual tour of the Liverpool Telescope site in La Palma is on this website at the Site Tour page. You can walk around the site, even into the telescope enclosure itself, and switch between day and night views.
Liverpool John Moores University's Press Office approached the LT group with a 360° camera and the suggestion we could borrow it to promote the telescope in any way we liked. We decided to use the camera to make a "Google Streetview" style tour around the site.
The images were made with a RICOH Theta S camera during a site maintenance trip in July 2019. They were processed into a tour using the Holobuilder interface (an adapted version of which also hosts the tour) and released on the website in October 2020. It's planned to integrate this tour into Google Streetview in the future.

Artist's impression of classical nova. Hydrogen spiralling onto the white dwarf's surface from the red giant has just ignited. See text for details.
Image credit: David A. Hardy www.astroart.org
The expanding debris shells from two separate novae that were seen to erupt decades ago, have been discovered and characterised in the recent paper "Two new nova shells associated with V4362 Sagittarii and DO Aquilae", Harvey et al, Monthly Notices of the Royal Astronomical Society (MNRAS), Vol 499, Issue 2, December 2020 (doi: 10.1093/mnras/staa2896).
Because these nova shells are big enough to make out their structure, they are rare objects and of great interest to astronomers. That's because analysis of the debris shells' shapes can reveal insights into the mechanics of the nova eruptions that created them, and also shed light on conditions leading up to the event.
Classical novae
Classical novae occur in close stellar binary systems, with one star a white dwarf and a main sequence star as its companion. The stars are close enough that hydrogen from the companion's outer layers can transfer over to the white dwarf and spiral down to its surface, forming an accretion disk as it does so (see illustration at right).
The infalling hydrogen forms a shallow hydrogen atmosphere at tremendous pressure and temperature. Over time as more hydrogen builds up, pressures and temperatures in the lower layers build up to the point where a runaway thermonuclear reaction starts. The bottom of the white dwarf's atmosphere ignites; heat released from the hydrogen fusing to helium raises the temperature further, increasing the fusion rate and driving the reaction more. This is the third most energetic stellar explosion in nature, and the energy release blows out the remaining atmosphere at speeds of 1000 km/s or more.
This debris of unburnt hydrogen and thermonuclear reaction products flies away from the binary system as an expanding shell. However, rather than being a perfect sphere, the shells that can be made out from Earth take the form of an axisymmetric set of zones. Usually the pattern is one of an equatorial belt and polar cones, but often more complex shapes are formed.
Rare specimens
Classical novae are actually non-destructive — both stars survive the event. This leaves them in place for the accretion process to begin again, potentially leading to another nova many years later. It's thought about 50 novae occur every year in the Milky Way galaxy alone, though fewer are actually observed due to intervening dust and gas obscuring the view.
Novae have also been observed in other galaxies, identified as such by their lightcurves and spectra, but none are close enough to make out any shells they might have. Of the few hundred novae in the Milky Way observed over the years, of order only 50 have discernible shells, so only that many sources of extra clues to the inner workings of novae have been observed and characterised. Any addition to this rare subgroup is therefore noteworthy, and the two new shells discussed in the paper by Harvey at al certainly qualify.
Observations
The team selected 12 reasonably bright nova systems that erupted more than 15 years before the start of the survey in 2015. Those regions had previously been scanned by the Wide-Field Infrared Survey Explorer (WISE) space telescope as part of its all-sky survey, and showed plausible hints of nebulosity. They then performed deeper narrowband imaging using the 3.2m Aristarchos telescope in H-alpha plus NII (6578A) and OIII (5011A) bands. Shells were found around two systems, V4362 Sagittarii and DO Aquilae.
The Liverpool Telescope's SPRAT spectrograph was used to apply velocity constraints and first-pass nebular analysis of the shells. Hi-resolution spectra were obtained of the V4362 Sgr nova shell using the second version of the Manchester Echelle Spectrograph, installed on the San Pedro Mártir Observatory 2.1m telescope.
DO Aquilae

Narrowband images of DO Aquilae and V4362 Sagittarii taken in 2016 & 2017 by Harvey et al using the Aristarchos 3.2m telescope. This image adapted from Figures 3 & 4 in the paper. Click image for bigger version.
DO Aquilae (DO Aql) was observed to go nova in 1925. The observations in this study, made in 2015 & 2017, reveal a previously undiscovered nova shell, expanding at a rate of about 0.07 arcseconds/year. The team estimate this system to be 6.7±3.5 kiloparsecs (22±11 thousand light years) distant.
V4362 Sagittarii
V4362 Sagittarii (V4362 Sgr) was discovered in 1994. Observations made two months later of polarised light emitted by the shell suggested it was axisymmetric, and possibly consisting of a circular equatorial ring and narrow conical polar caps.
Harvey et al processed data from the 1.3m Skinakas Telescope in Crete made in 2006, and found the nova shell back then to be 2.5x3.1 arcseconds in size, in Halpha+NII narrowband imagery. The 2016 data obtained with the Aristarchos telescope gave dimensions as 5.2x5.6" in Hα+NII and 5.2x5.5" in OIII, implying an expansion rate of 0.32 arcseconds/year.
The probable inclination of the system is 70-80°, based on lightcurves taken in 2018 with the RISE2 instrument on the Aristarchos telescope that suggest the system is eclipsing. If eclipses are observed then the system is probably being viewed nearly edge-on to the plane of its orbit. However, eclipses don't always mean edge-on viewing, so more detailed observations of this system are needed to make sure.
Spectral measurements show the shell velocity is relatively slow at just 350 km/s, rather than the average 1000 km/s. Coupling that with the observed increase in angular diameter over a known period of time and taking due notice of the shell's non-sphericity (the expansion parallax method), the distance to the system is found to be just \( 0.5_{-0.2}^{+1.4} \) kiloparsecs (between 1-6 thousand light years), making it one of the closest and brightest nova shells known.

Detail adapted from Figure 12 of the paper, showing a model of the shell's emission in the NII and OIII lines, see text for more details. The full figure shows the shell in other wavelengths and viewing angles. Click image for bigger version.
The shell of V4362 Sgr is poorly resolved in the Aristarchos imagery, so the team tried to visualise its shape and dynamics. They settled on a morphology of an equatorial belt, tropical rings and polar cones. The image at right shows a pseudo-3D photoionisation model of the shell's structure seen from an angle 10° above the orbit plane. There are two views, showing the shell in the light of singly-ionised nitrogen ("NII") at 6584Å, and doubly-ionised oxygen ("OIII") at 5007Å. The model replicates the ratio of NII to OIII emission observed. Note the NII emission structure is larger than the OIII, which is often seen in nova shells. The NII structure's more extended polar caps in this model may be why the real thing is so bright at these wavelengths.
Summing up
This paper shows that new nova shells can be found from archive data and new limited multi-epoch followup data from small to medium-sized research telescopes — two previously unknown nova shells were discovered and characterised in this way.
There are potentially very many nova shells remaining to be discovered, because (a) so far only 10% of the observed nova system population of the Milky Way galaxy are known to have shells, and (b) it should be possible to detect and determine the structure of more shells if larger aperture and/or space-based telescopes are used.
Because the processes at play during nova events leave their fingerprints in the shell's structure, and nova systems previously thought to be shell-less might actually harbour shells after all, the authors would like there to be more deep followup observations of historical novae. Untangling the geometry of new shell structures would lead not only to a better understanding of the geometry, ionisation conditions and abundances of chemicals in the nova systems, but also reveal information on the chemical enrichment of the interstellar medium through elements created during the thermonuclear process in the nova events themselves.