
RATCam

RATCam was decommissioned at the end of February 2014. The information presented here is for historical purposes only. The common user, visible light CCD imager is now IO:O.
- Specifications/performance
- Zeropoints
- Filter Set
- Standards
- Colour Terms
- Saturation & Charge Persistence
- Pipeline
- Phase 1 Information
- Phase 2 UI Instructions
Introduction
RATCam was the Liverpool Telescope's main workhorse optical CCD camera and was funded by PPARC (now STFC). It was built jointly by JMU (responsible for software and integration), TTL (responsible for the filter wheel mechanisms) and Astro-Cam at SDSU (responsible for the Dewar, cooler and controller).
Specifications & Performance
| Detector | 2048x2048 pixel EEV CCD42-40, back-illuminated non-aimo AR coated broadband chip | |||||||||||||
| Pixel size | 13.5 microns | |||||||||||||
| Pixel scale | approx. 0.135 arcsec/pixel (unbinned) | |||||||||||||
| Field of view | 4.6x4.6 arcmin | |||||||||||||
| Read noise | < 5 electrons | |||||||||||||
| Pattern noise | None measurable | |||||||||||||
| Dark current | None measurable | |||||||||||||
| Binning | 1x1, 2x2, 3x3, 4x4 | |||||||||||||
| Readout time | ~10 sec (1x1), ~5 sec (2x2) | |||||||||||||
| Windowed modes | Contact us | |||||||||||||
| Bad pixels | 67 dark point defects; one bad column (these are manufacturer's spec) click here for bad pixel masks |
|||||||||||||
| Gain (1x1) | 2.34 electrons/count | |||||||||||||
| Gain (2x2) | 2.13 electrons/count | |||||||||||||
| Quantum Efficiency |
* Measurements made at -85°C. RATCam's operating temperature is -107°C however. |
Zeropoints
The following approximate zeropoints are per photoelectron. Remember to take account of the gain if you are considering counts.
Band |
Zeropoint (one photoelectron) |
||
Sloan u' |
21.3 |
||
Bessell B |
24.4 |
||
Bessell V |
24.3 |
||
Sloan r' |
24.5 |
||
Sloan i' |
24.1 |
||

Filter Set
Filter Name |
Wavelength Range |
3150 - 3900 |
|
4100 - 5500 |
|
5560 - 6890 |
|
6930 - 8670 |
|
8510 -> |
|
3780 - 4830 |
|
4950 - 5950 |
|
6517 - 6617 |
There were a total of eight core filters, which were chosen to maximize scientific utility to both stellar and extragalactic astronomers combined with high throughput. The core filter set is given in the table at right. Filter transmission curves can be downloaded by clicking on the filter name. Note that the transmission curves are measured at 20 degrees Centigrade and in a collimated beam, and therefore will need to be corrected for the actual temperature at the time of observation and the f/10 beam of the telescope. Observations could also be made in "clear" mode, i.e. unfiltered.
There are two factors of which to be aware when considering the H-alpha filter:
- The plate scale when using the H-alpha filter was approximately 0.138 arcsec/pix in contrast to 0.140 arcsec/pix in the other filters.
- The H-alpha filter generated weak ghost images from any bright sources which appeared in the field. The secondary image can be located by linearly extrapolating a vector from the instrument's optical axis through the primary image of the star in length by a factor of 1.0620. Flux in the secondary image is 1% of the primary.
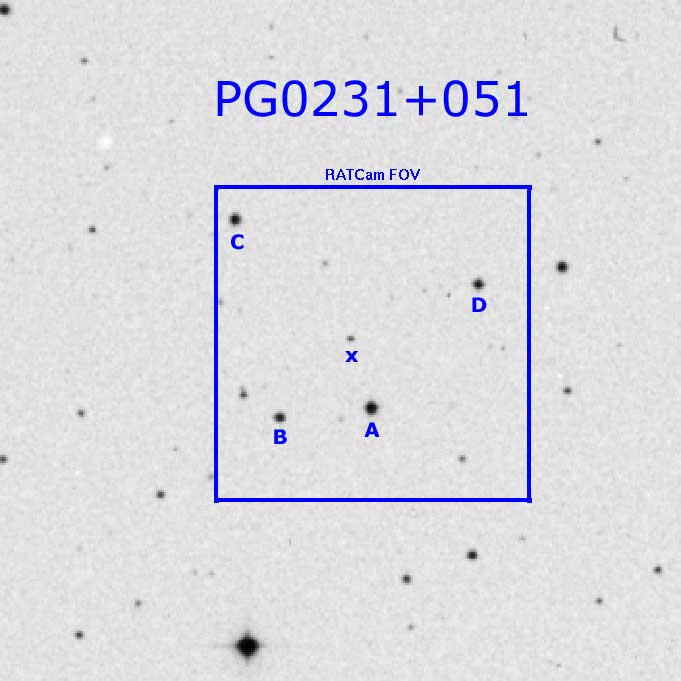
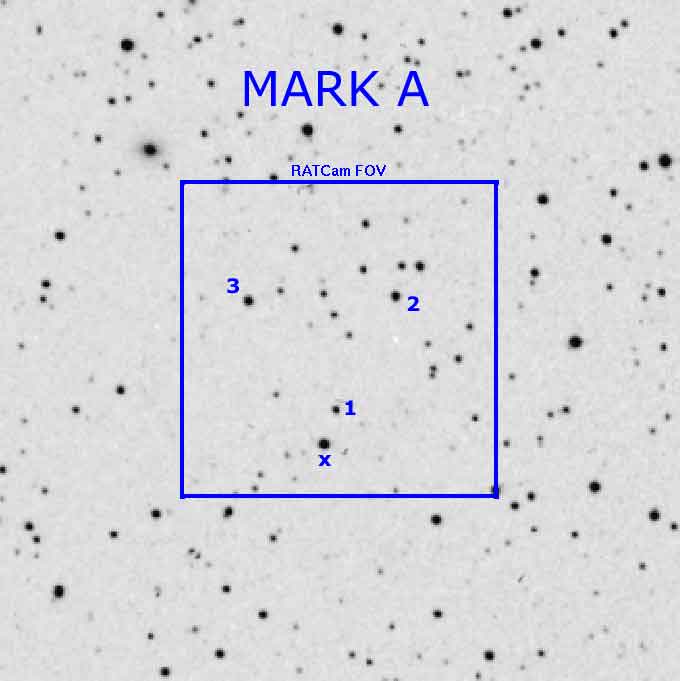
Standards
Standard fields for RATCam were based on the Landolt series of standards (link to Landolt paper on NASA ADS). They were spaced every few hours of RA and were observed in all bands every two hours by the robotic control system. If observers required standards beyond what were specified here they requested them explicitly in their Phase 2 sequence definition. Note: The time needed for these observations had to be included in applications for telescope time (since observers were charged for any time spent observing extra standards for their programme.)
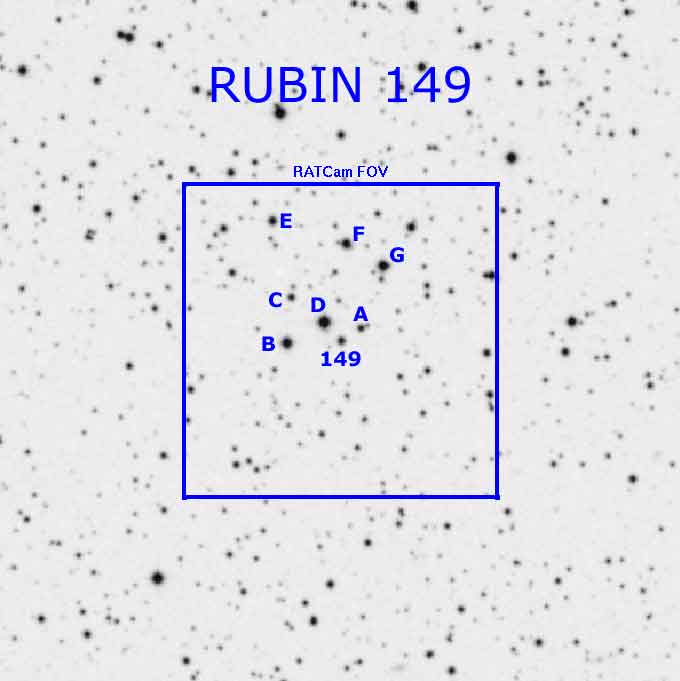
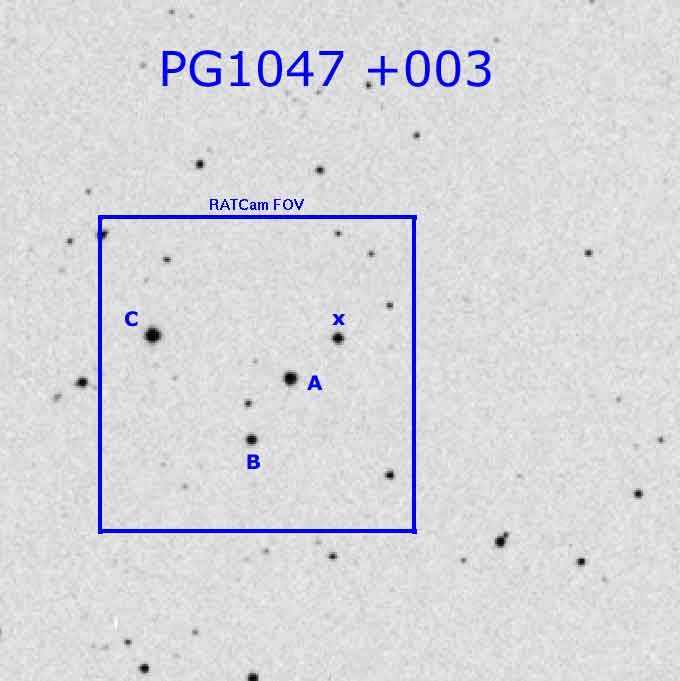
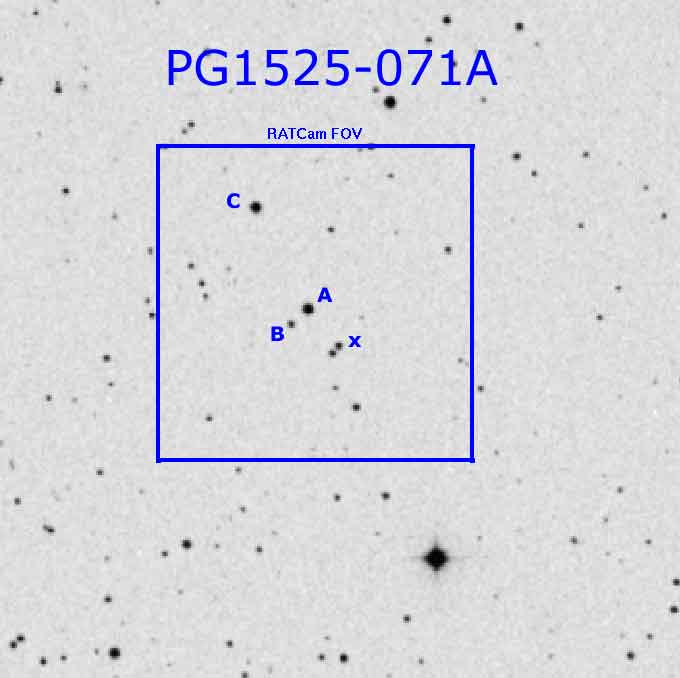
Clicking the name of the field brings up an image of the field with north at top and east to the left. All images are taken from the Digitised Sky Survey "POSS-1 Red" archives. Annotated stars' magnitudes are V-band, taken directly from the Landolt paper.
Name |
J2000 |
V |
|
RA |
Dec |
||
02h 33m 40.0s |
+05° 18' 40.0" |
(x) 16.105±0.0068 |
|
07h 24m 14.4s |
-00° 33' 04.0" |
(x) 13.866±0.0022 (A) 14.495±0.0066 (B) 12.642±0.0021 (C) 14.425±0.0052 (D) 11.480±0.0019 (E) 13.718±0.0064 |
|
10h 50m 07.6s |
-00° 01' 07.3" |
(x) 13.474±0.0039 (A) 13.512±0.0047 (B) 14.751±0.0050 (C) 12.453±0.0094 |
|
15h 28m 13.0s |
-07° 15' 54.0" |
(x) 15.053±0.0000 (A) 13.509±0.0000 (B) 16.403±0.0000 (C) 13.530±0.0000 (D) 16.301±0.0021 |
|
20h 43m 58.3s |
-10° 46' 10.0" |
(x) 13.258±0.0019 (1) 15.911±0.0040 (2) 14.540±0.0028 (3) 14.818±0.0024 |
|
23h 33m 48.0s |
+05° 46' 10.7 " |
(x) 15.182±0.0057 (A) 13.051±0.0021 (B) 14.744±0.0035 |
|
Colour Terms
Preliminary colour terms were calculated for RATCam to allow transformation from instrumental to catalogue magnitudes.
| (1) | g_inst |
= |
g_cat + A_g * (g_cat-r_cat) |
| (2) | r_inst |
= |
r_cat + A_r * (r_cat-i_cat) |
| (3) | i_inst |
= |
i_cat + A_i * (r_cat-i_cat) |
| (4) | z_inst |
= |
z_cat + A_z * (i_cat-z_cat) |
| (5) | B_inst |
= |
B_cat + A_B * (B_cat-V_cat) |
| (6) | V_inst |
= |
V_cat + A_V * (B_cat-V_cat) |
| (7) | R_inst |
= |
R_cat + A_R * (V_cat-R_cat) |
| (8) | I_inst |
= |
I_cat + A_I * (V_cat-I_cat) |
where:
f_inst |
= |
instrumental magnitude in filter f: |
||||||||||||||||||||||||||||
f_cat |
= |
catalogue magnitude in filter f | ||||||||||||||||||||||||||||
A_f |
= |
colour term in filter f, given by:
|
Saturation & Charge Persistence
Objects that were heavily saturated (i.e. above 65000 counts and bleeding) could leave persistent "ghost" images on subsequent frames. The residual image faded as a roughly linear function of time. There was unfortunately nothing that could be done about this, and the best approach was just to make sure it did not happen in the first place. It was therefore important that observers carefully checked their fields to ensure that no bright objects near their target would be grossly saturated in their requested integration time.
The telescope operations staff occasionally at their discretion reduced exposure times or removed targets from the observing database. In such cases they contacted the PI to discuss how best to meet their science objectives without endangering the equipment or other observers' programmes.
Pipeline
Basic instrumental reductions were applied to all RATCam images before the data were passed to users. This included bias subtraction, trimming of the overscan regions and flat fielding. A library of the current calibration frames was maintained as part of the data archive and updated daily so that images were always reduced using the latest available flat-field image available at the time. Each of the operations were performed as described below.
Bias Subtraction
There was insufficient repeatable structure for bias frames to be useful. Bias subtraction was therefore based purely on analysis of the underscan region. Linear regression was used to determine a fit to the bias counts as a function of pixel row number and values deducted across the image according to this smooth function. Experience showed that RATCam did have a small ramp in the bias down each column and this first order fit was required. No attempt was made to remove any bias gradient in rows across the image.
Overscan Trimming
The overscan regions were trimmed off the image leaving a 2048x2048 (assuming on-chip binning was not used) pixel image.
Dark Substraction
This was not performed though the facility existed in the reduction pipeline. Experience showed that when the camera was at normal operating temperature, dark current was not significant. If the camera temperature fluctuated for any reason, the dark current was sufficiently variable that a dark would need to be obtained with every frame and library dark frames were of no use.
Flat Fielding
The appropriate master flat field was selected from the library to match the filter and binning configuration of the current exposure. In fact the library held reciprocal flat-fields normalised to unity because of the computational efficiency of multiplying rather than dividing. The image data were therefore multiplied by the library flat.
Each twilight the instrument control software (ICS) attempted to update the oldest master flats in its library, by taking 3-5 raw sky flats for each filter/binning combination, giving preference to the most used. There usually wasn't enough time to take sky flats for all combinations in one twilight session, so the next oldest in the list was attempted in following nights and so on. Usually the update was complete after 2-3 nights and the process started again.
The master flat was derived from the median of each sky flat after each had been normalised to the common mean count level. New master flats, and their corresponding ratio image of new/old masters, were inspected for any corruption, inclusion of stars, etc.
Bad Pixel Mask
No cosmic ray rejection or bad pixel mask was applied since it was important for users performing accurate photometry to know exactly what masking had been applied. However, bad pixel masks were generated and kindly made available by the Angstrom project, a gravitational lensing programme performed on the LT and RoboNet:
- unbinned bad pixel mask (13KB gzipped FITS, unzips to 8MB)
- 2x2 binned bad pixel mask (5KB gzipped FITS, unzips to 2MB)
Vignetting
The filter wheel slightly vignetted the optical beam to a different extent for each filter. In the extreme corners of the worst affected bands (i' and g') the flux was reduced by up to 15% compared to the unobstructed beam. In the other filters, obscuration was about 5% in the very corner of the observed field, falling to negligible values between 10 - 20 arcsec from the field edge.
The vignetting generally flat fielded out very well and was rarely obvious in the reduced data, sometimes leaving distortions only in the range 3 - 5 arcsec from the field corner. Even where the data was well flat fielded though, noise characteristics of photon counting statistics could be affected in these regions of the frame.
Fringe Frames
Automated defringing was not performed on CCD data
before it was loaded into the archive. To help you defringe
your own historical data, linked below are prepared master fringe frames created
by stacking multiple deep integrations of blank fields. The master
fringe frames were updated infrequently because the fringes on the CCD
were found to vary only on timescales of months. If you need
access to the individual integrations which went into building these
master frames, they are still publicly available from the data archive. Simply
select RATFringe from the Proposal ID
drop-down list.
|
|
FITS Header Error Codes
Error codes were written into the FITS headers for specific error flags brought up during processing. These error flags are stored in the header keywords L1STATOV, L1STATZE, L1STATTR, L1STATFL and L1STATDA and follow this convention:
- negative values are failure states (special case: -1 = operation not attempted)
- positive values are warning states (special case: +1 = no errors or warnings)
Tables of failure and warning states are given below - but please
note these are not exhaustive lists.
Code # |
Process Name |
Error String |
-12 |
DpRT_startup |
Input is not a valid LT filename. |
-14 |
DpRT_startup |
According to filename flags, input has already been processed. |
-15 |
DpRT_startup |
Run_mode is not valid (%d). See dprt.h for valid values. |
-18 |
DpRT_startup |
Invalid exposure type flag. |
-35 |
DpRT_zero |
Cannot find zero (bias) frame file. |
-37 |
DpRT_dark |
Cannot find dark frame file. |
-38 |
DpRT_flat |
Mean counts in flat <= 0. Processing abandoned. |
-40 |
DpRT_flat |
Cannot find flatfield file. |
-60 |
DpRT_fringe |
Cannot find fringe file. |
-61 |
DpRT_fringe |
Fringe and data frame sizes do not match. |
-63 |
DpRT_fringe |
Correlation scaling failed. No defringing performed. |
-73 |
DpRT_dark |
Correlation scaling failed. No dedarking performed. |
-261 |
Error opening FITS. |
|
-263 |
Error getting header keywords. |
|
-264 |
Non-square binning. |
|
-268 |
Error reading image array. |
|
-354 |
DpRT_make_bias |
Could not open working directory. |
-356 |
DpRT_make_bias |
Failure to allocate memory for **fits_pointers. |
-357 |
DpRT_make_bias |
Failed to open FITS file. |
-358 |
DpRT_make_bias |
Failed to allocate memory to median_array or new_bias_array. |
-359 |
DpRT_make_bias |
Failed to allocate memory to temp_array. |
-360 |
DpRT_make_bias |
Failed to allocate memory to temp_array[%d]. |
-361 |
DpRT_make_bias |
Failed to read image data from FITS file number %d. |
-363 |
DpRT_make_bias |
Poor stats in new_bias. |
-453 |
DpRT_make_flat |
Could not read file (outer loop). |
-454 |
DpRT_make_flat |
Could not open directory %s (inner loop). |
-462 |
DpRT_make_flat |
Fewer than %d good flats from which to make master flat. |
-452 |
DpRT_make_flat |
Could not read existing flat frame. |
-356 |
DpRT_make_flat |
Failure to allocate memory for **fits_pointers. |
-364 |
DpRT_make_bias |
New bias is highly deviant from the old one: mean abs dev = %. |
-454 |
DpRT_make_flat |
Could not open directory. |
-457 |
DpRT_make_flat |
Failed to open FITS file. |
-458 |
DpRT_make_flat |
Failed to allocate memory to median_array or [mean|median]_flat_array. |
-459 |
DpRT_make_flat |
Failed to allocate memory to temp_array. |
-460 |
DpRT_make_flat |
Failed to allocate memory to temp_array[%d]. |
-461 |
DpRT_make_flat |
Failed to read image data from FITS file number %d. |
Code # |
Process Name |
Error String |
32 |
DpRT_startup |
CCD not at thermal set point. |
52 |
DpRT_output |
No filter calibration data for filter. |
53 |
DpRT_output |
No filter calibration data. |
62 |
DpRT_fringe |
No correlation between data and fringe. Defringing will use simple exposure time scaing. |
64 |
DpRT_fringe |
Correlation scaling failed. Simple exposure time scaing will be used. |
72 |
DpRT_dark |
No correlation between data and dark. Dedarking will use simple exposure time scaing. |
220 |
DpRT_init |
No '.' character in flatfield filename. |
225 |
DpRT_init |
Divide-by-zeroes were safely trapped. |
226 |
DpRT_init |
Failed to trim the flat field. |
230 |
DpRT_init |
Failed to open FLATLIB directory. |
232 |
filter_params |
Failed to open filter parameter lookup table. |
233 |
filter_params |
Failed to parse filter config line. |
231 |
filter_params |
Failed to allocate name memory for filter. |
234 |
filter_params |
Filter config line has a name > 49 chars. |
235 |
filter_params |
Filter scale factor or ZP read from file is not valid for filter. |
236 |
filter_params |
Failed to allocate filter memory. |
251 |
DpRT_init |
Failed to allocate memory for *photstar_data. Calibration data will not be available. |
252 |
DpRT_init |
Failed to open photstar parameter lookup table. |
351 |
DpRT_make_bias |
Could not open log file. |
352 |
DpRT_make_bias |
Could not read existing bias frame. |
353 |
DpRT_make_bias |
Could not read file. |
355 |
DpRT_make_bias |
Too many good bias frames were found. |
362 |
DpRT_make_bias |
New bias is highly discrepant from library bias. |
366 |
DpRT_make_bias |
More bias frames were discarded than kept. |
367 |
DpRT_make_bias |
Fewer than %d good bias frames. |
363 |
DpRT_make_flat |
Poor stats in new [mean|median] flat. |
364 |
DpRT_make_flat |
New flat is highly deviant from the old one. |
365 |
DpRT_make_flat |
No suitable flat frames found in directory. %d were read but discarded. |
453 |
DpRT_make_flat |
Could not read file (inner loop). |
500 - 507 |
DpRT_init |
NULL pointer in dprt_*_lib. |
Phase 1 Information
RATCam operated in a very similar manner to IO:O. Users calulating the amount of time required for a complete observation followed the same algorithm as for that instrument, but using the following numbers:
- Acquisition time Ta - 60 seconds (time taken to slew the telescope on target).
- Autoguider acquisition - 45 seconds (only if you nominate to use the autoguider).
- Filter change time Tf - 5 seconds.
- Readout time Tr - 10 seconds.
Phase 2 UI Instructions
Historical instructions on using the Phase 2 GUI to program the LT to use RATCam:
RATCam Phase 2 Instructions

![[GIF]](Halpha_throughput.gif)