
Meaburn Spectrograph

The Meaburn Spectrograph was decommissioned in March 2009 and replaced with FRODOSpec. Details are being kept on this site for historical purposes.
Introduction
Meaburn was a simple prototype low dispersion spectrograph developed for the Liverpool Telescope in a collaboration between John Meaburn of Jodrell Bank Observatory University of Manchester, and LJMU. It was designed to prove the concept of robotic spectroscopy using an integral field design, and as such was not a common user instrument for the telescope.
Specification
The spectrograph was built from commercial components designed for the high-end amateur market of the time, specifically the NuView spectrograph and the Apogee AP7 CCD Camera. The spectrograph was fed using a close packed fibre bundle input array, consisting of 49 x 0.8 arcsecond diameter fibres which were reformatted as a slit with the fibres in random order. The detector was a 512x512 pixel thinned Tektronix array windowed to 512x175 pixels and thermoelectrically cooled to 258 Kelvin. The dark current was 8 counts/sec. Sensitivity: For an object with V=11 a 180 second exposure yielded an SNR per pixel of 8.
Acquisition and Calibration
Two modes of acquisition onto the spectrograph were available:
- WCS FIT: In this mode the user provided accurate (within 1-2 arcsec) target coordinates. An acquisition frame using RATCam would be automatically obtained when the observation is executed, and a WCS fit carried out to that frame against the USNO B2 catalogue. Assuming the fit was successful (i.e. sufficient bright reference stars found), then the telescope was offset to move the supplied coordinates onto the reference pixel, and another RATCam image taken to confirm the offset was correctly applied. For targets brighter than ∼8th magnitude in the USNO catalogue (i.e. not for outbursting objects which are normally fainter than this) the USNO catalogue contained an exclusion zone around the target which meant that this method would fail.
- BRIGHTEST: In this mode an acquisition frame was obtained using RATCam, and then the telescope offset to place the brightest object on the frame at the reference pixel. Another RATCam image would then be taken to confirm the offset was correctly applied. This mode was generally used in situations where the WCS would fail due to catalogue incompleteness caused by bright sources in the field.
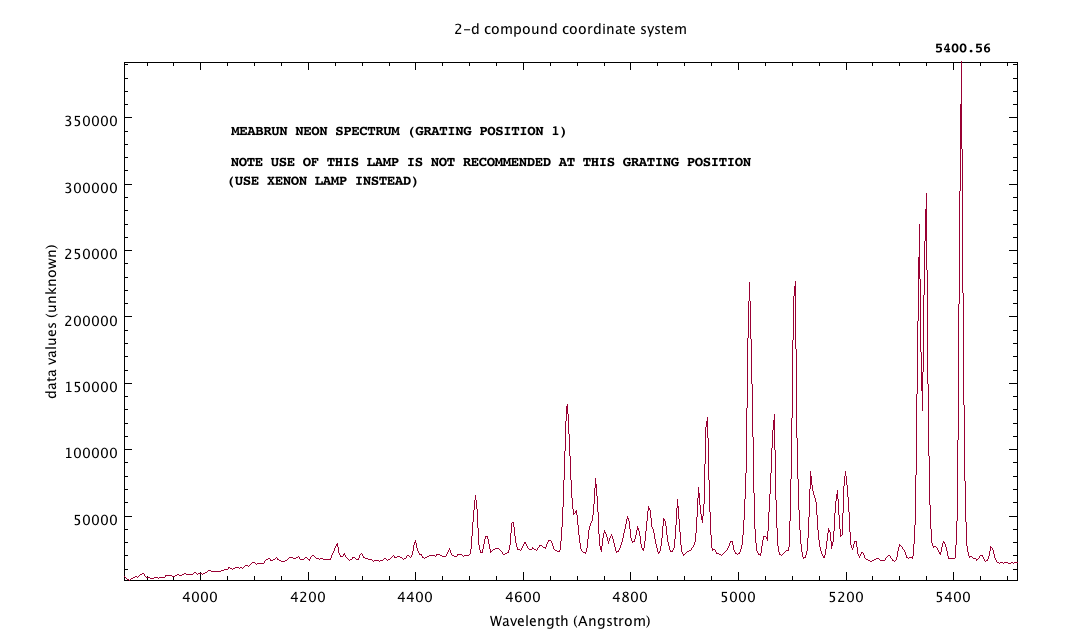
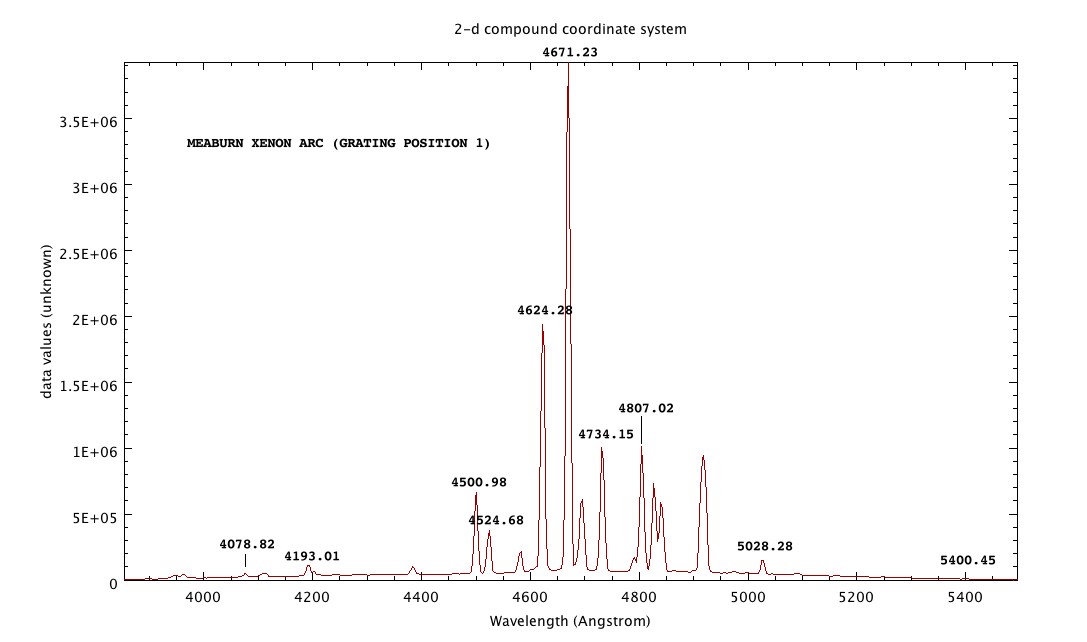
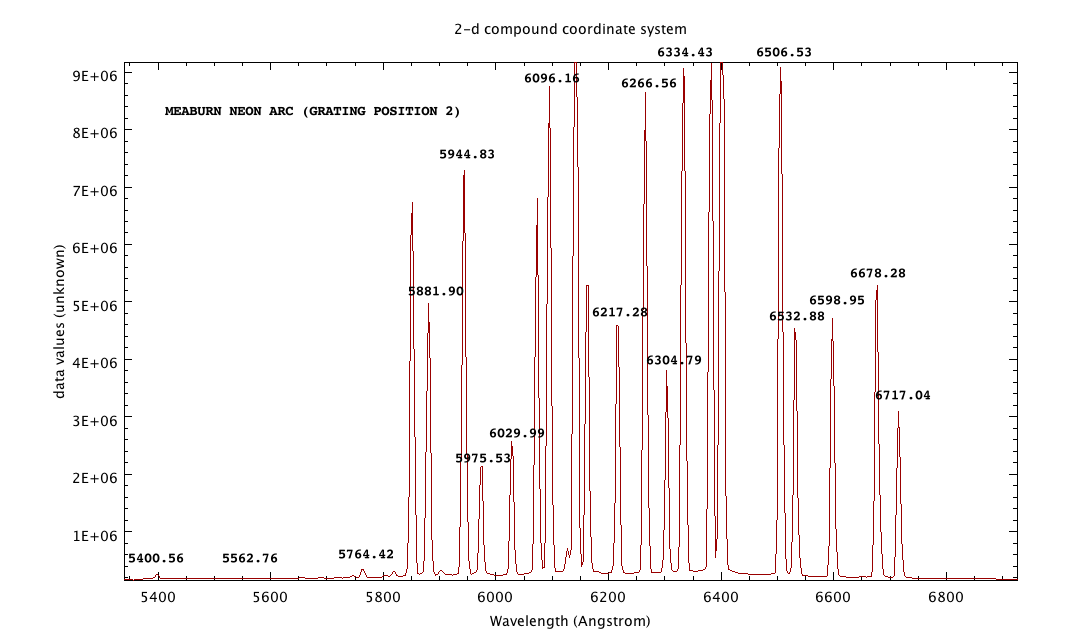
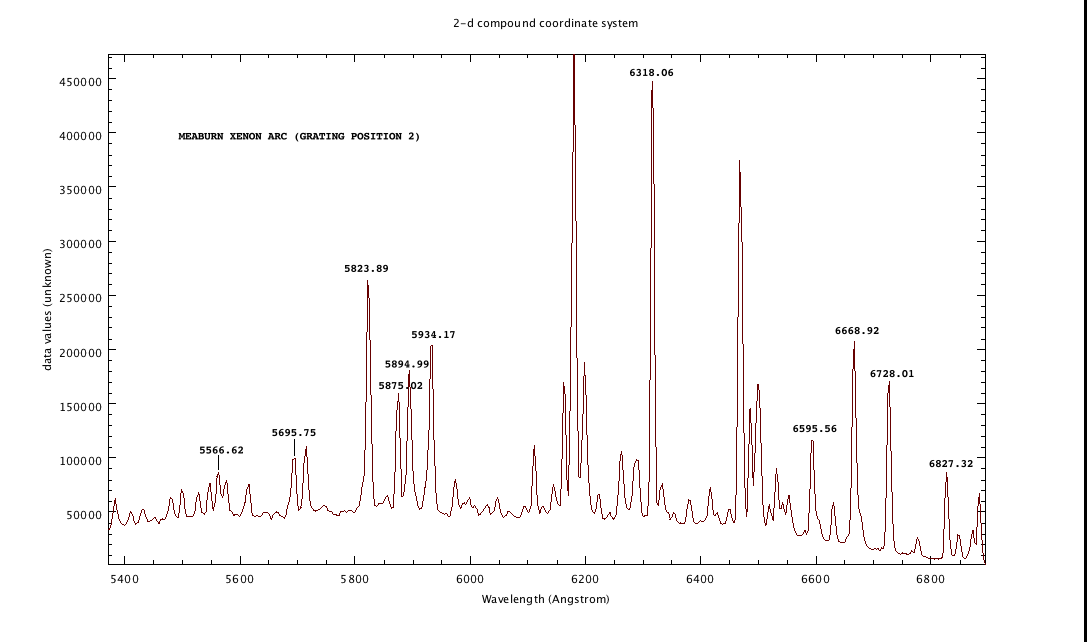
Xenon and Neon arc lamps (and a Tungsten continuum lamp) were avaliable. As with Meaburn's successor FRODOspec, arc lamp exposures were important both to calibrate the built-in spatial distortion in the system, and to provide wavelength calibration. While it was possible to obtain data without carrying out an arc calibration, it wasn't recommended. Any data taken without a matching arc would not have been reduced by the pipeline beyond simple dark frame subtraction, and responsibility for the subsequent reduction would have been entirely that of the user.
In general (for all grating positions) it was always recommended that a Xenon arc should be obtained whenever the grating was moved . Use of the Neon arc was not recommended as it could saturate the detector and leave residuals on subsequent images. The overhead for obtaining an arc was 60 seconds.

Pipeline
The data reduction pipeline ran on all Meaburn data. Assuming the matching calibrations were taken, it provided dark removal, distortion correction, wavelength calibration, sky subtraction and optimal extraction, before data was distributed to the user as both 2D and 1D spectra.
The initial stages of the data pipeline performed debiasing and dark subtraction. Experience showed the array to be sufficiently flat so that carrying out flat-fielding brought no benefit to the extracted spectrum. The resulting file (named *1.fits) was distributed to users when no matching arc was found.
If a matching arc was found, then a third order 2D wavelength/distortion map was created using the STARLINK Figaro ARC/IARC/ISCRUNCH routines and applied to the object image. Sky subtraction based on identification of non-object areas of the 2D spectrum was then carried out if significant sky lines were visible using FIGARO POLYSKY. A 1D spectrum was then automatically extracted using the PROFILE and OPTEXTRACT routines. The resulting spectrum was available as a FITS image extension in the *_2.fits files downloaded from the archive. The primary image remained as a 2D spectrum to enable users to extract spectra themselves if they wished.
Starlink users extracted the appropriate extension using the CONVERT FITS2NDF command to select which extension they wished to convert to an .sdf file for further use, e.g. to extract the image from the multipart FITS file "n_e_20080311_2_1_1_2.fits", one would use:
fits2ndf "n_e_20080311_2_1_1_2.fits[0]"
and to extract the spectrum use:
fits2ndf "n_e_20080311_2_1_1_2.fits[1]"
Wavelength Ranges and Arc Spectra
The spectrograph provided three fixed grating positions, which when overlapped gave complete coverage from 3900-8000Å. More details are given in the table below.
| Grating Position 1 (4588Å) | 3861 - 5526Å (3.25Å/pix) Neon Arc | Xenon Arc | |
| Grating Position 2 (6181Å) | 5350 - 6888Å (3.00Å/pix) Neon Arc | Xenon Arc | |
| Grating Position 3 (7294Å) | 6561 - 8006Å (2.82Å/pix) Neon Arc | Xenon Arc |
