FRODOspec
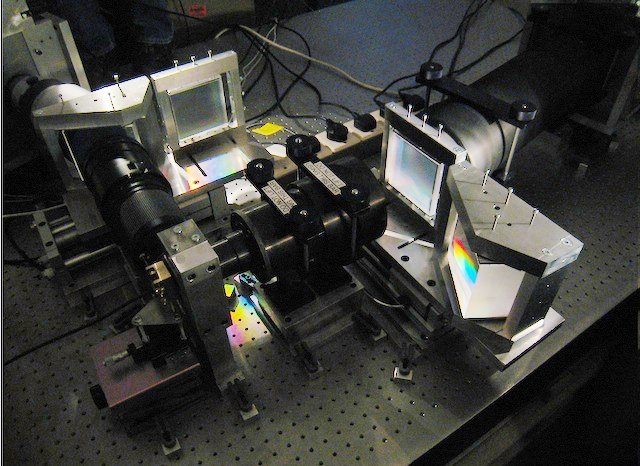
Part of FRODOSpec on optical bench before shipping to site.
© 2007 A.Scott. (click for bigger [85KB])
- Introduction
- Current Status
- Specification and Capability
- Sensitivity
- Twilight & Tungsten Flats
- Acquisition
- Data Reduction Pipeline
- Wavelength & Flux Calibration
- Phase 1 Information
- Phase 2 Information
Introduction
FRODOSpec (Fibre-fed RObotic Dual-beam Optical Spectrograph) is a SRIF collaboration with the University of Southampton to develop a multi-purpose integral-field input spectrograph for the Liverpool Telescope. As the name implies it is a dual beam design with the beam split before the entrance to the individually optimized collimators. Two resolution options are available on each arm. With low resolution selected on each arm, the entire spectrum from the blue cutoff of the optical fibres (around 3800 Angstroms) to the red limit of the detectors at around 1 micron can be obtained in a single shot. The low resolution is implemented using conventional transmission gratings.
The higher resolution option for each arm is provided using a VPH grating bonded to a prism in order to throw the beam to the same angle as that obtained using the diffraction grating at low resolution. The central wavelengths in this configuration are fixed (centered around features of astrophysical interest).
The spectrograph is bench mounted on the observing floor of the telescope enclosure and is fed using a fibre bundle from the Cassegrain focus of the telescope. An integral field unit using a microlens input array feeds the fibre bundle.
Current Status
Offline
Due to reliability issues and pandemic travel restrictions preventing maintenance visits to the telescope, FRODOSpec was not offered for use in the 21A call for proposals and was taken offline at the end of semester 2020B, on 1st March 2021. It will remain offline until such time as maintenance and refurbishment become possible.
Specification & Capability
| Parameter | Blue arm |
Red arm |
| Low Resolution (Grating) Wavelength Range (Å) | 3900-5700 |
5800-9400 |
| High Resolution (VPH) Wavelength Range (Å) | 3900-5100 |
5900-8000 |
| Resolving Power (low dispersion) |
2600 |
2200 |
| Resolving Power (high dispersion) |
5500 |
5300 |
| Integral Field Input Module: | 9.84"x9.84" 12x12 lenslets each 0.82 arcsec on-sky |
|

Sensitivity
The following sensitivities have been measured using the engineering arrays, and so provide a conservative estimate of the final sensitivity of the instrument suitable for preparing proposals for the next Semester. The sensitivity figures below are zeropoint magnitudes, calculated in the AB magnitude system to get one detected photon/second/Angstrom.
| Wavelength | Red VPH | Red Grating | Blue VPH | Blue Grating |
| 4000 | - | - | 12.9 | 12.5 |
| 4500 | - | - | 14.5 | 14.2 |
| 5000 | - | - | 13.8 | 14.2 |
| 5500 | - | - | - | 13.3 |
| 6000 | 13.8 | 14.2 | - | - |
| 6500 | 15.4 | 15.1 | - | - |
| 7000 | 15.3 | 14.9 | - | - |
| 7500 | 15.0 | 14.9 | - | - |
| 8000 | 14.6 | 14.3 | - | - |
| 8500 | - | 13.8 | - | - |
| 9000 | - | 13.0 | - | - |
Alternatively, users may now use the Spectroscopy Exposure Time Calculator.
Twilight and Tungsten flats for tracing fibres
Starting 9th June 2010, tungsten lamp flats have been obtained automatically every night and are used for all level 2 pipeline reductions.
Prior to June 2010, pipeline reductions were performed using the twilight sky flat fields which are available here to download. The provided flats are a mean of 5-7 frames taken on the same night and have been passed through the same data reduction pipeline as the science data, so have been cropped in the same way. These provide a means of tracing the fibre positions in the 2D spectra for early data which are only avaiulable in the data archive as level 1 reductions.
Valid from 20th March 2010 to July 2010:
- 20100330 BLUE LOW RESOLUTION Blue-Low_1_20100330.fits
- 20100330 BLUE HIGH RESOLUTION Blue-High_1_20100330.fits
- 20100330 RED LOW RESOLUTION Red-Low_1_20100330.fits
- 20100330 RED HIGH RESOLUTION Red-High_1_20100330.fits
Valid from 26th November 2009 to 12th March 2010:
- 20091127 BLUE LOW RESOLUTION Blue-Low_1_20091127.fits
- 20091127 BLUE HIGH RESOLUTION Blue-High_1_20091127.fits
- 20091127 RED LOW RESOLUTION Red-Low_1_20091127.fits
- 20091127 RED HIGH RESOLUTION Red-High_1_20091127.fits
Valid from 2nd October 2009 to 24th November 2009:
- 20091108 BLUE LOW RESOLUTION Blue-Low_1_20091108.fits
- 20091108 BLUE HIGH RESOLUTION Blue-High_1_20091108.fits
- 20091108 RED LOW RESOLUTION Red-Low_1_20091108.fits
- 20091108 RED HIGH RESOLUTION Red-High_1_20091108.fits
Acquisition
Two modes of acquisition onto the spectrograph are provided. Each relies on using an imager to fine tune the telescope pointing and place the target precisely in the focal plane so that it will lie on the FrodoSpec IFU.
"WCS FIT"
In this mode you must provide accurate (within 1-2 arcsec) J2000 coordinates for your target. Just picking the coordinates listed by SIMBAD will often not be good enough. If you do not have recent high quality astrometry already, consider checking it with a brief shapshot image (e.g., 10 sec, binned 2x2, r-band on IO:O) of your field first before investing your time allocation in long FRODO integrations. For "WCS FIT" acquisition, a frame is obtained first using the imager (e.g., IO:O) and a WCS fit carried out using USNO-B2 and 2MASS reference catalogues. Assuming the fit is successful (i.e. there are sufficient, and bright enough, reference stars found), then the telescope will be offset to move the supplied coordinates onto the reference pixel, and another image taken to confirm the offset was correctly applied. The process iterates until the requested coordinates lie accurately (±2arcsec) on the reference pixel. It is important to note that for targets which are brighter than around 8th magnitude in the USNO catalogue (i.e. not for outbursting objects which are normally fainter than this) the USNO catalogue will contain an exclusion zone around the target from the saturated photographic plates which means that this method could fail. For such bright targets use BRIGHTEST acquistion mode. You must supply J2000 coordinates.
"BRIGHTEST"
In this mode an acquisition frame will be obtained using the imager and the telescope offset to place the brightest object on the frame at the reference pixel and another image taken to confirm the offset was correctly applied. This mode is generally used in situations where the WCS would fail due to catalogue incompleteness due to bright sources in the field. For this to work, your target must be the brightest source within one full field-of-view of the acquisition camera. I.e., if using IO:O then there cannot be any brighter source within 10arcmin of your target.
Magic Pixel
The acquisition process moves the target onto a "magic pixel" on the imager CCD. The location of this pixel varies slightly whenever the imager (or FRODOSpec fibre buindle) is taken off the telescope. However, with IO:O it should usually be close to pixel 1110,939.5 (in 2x2 binned IO:O acquisition images - currently the default). Targets should thus be located on or very close to this pixel in the final acquisition image obtained just before spectra are acquired. Note that all acquisition images are made available to the user.
Choice of acquisition camera
The default and recommended choice is the primary science imager, currently IO:O. Other instruments can be used as acquistion cameras in certain cirumstances, but we suggest contacting us if you think that may be necessary for your observations. One example might be that you want to use BRIGHTEST acquistion in which case the smaller FoV of SPRAT makes it easier to ensure your target is the brightest thing in the frame.
Data Reduction Pipeline
Data taken with FRODOSpec are reduced by two sequentially invoked pipelines. The first pipeline, known as the L1, is a CCD processing pipeline which performs bias subtraction, overscan trimming and CCD flat fielding. The second pipeline, known as the L2, performs the processes unique to IFS reduction. The L2 became operational on 9th July 2010, with the second version released in May 2011. The description in the following sections conforms to the second version of the pipeline.
Full details of the pipeline may be found in the paper Barnsley, Smith and Steele.
L2 Pipeline
L2 data products are eight part multi-extension FITS files with each extension containing a snapshot of the data taken at key stages in the reduction process. The lowest tier of reduction product available to the user is the L1 image. The output data product format is shown below.
| HDU Index | EXTNAME | Details |
| 0 | L1_IMAGE | L1 image |
| 1 | RSS_NONSS | Non sky subtracted row stacked spectra |
| 2 | CUBE_NONSS | Non sky subtracted datacube |
| 3 | RSS_SS | Sky subtracted row stacked spectra |
| 4 | CUBE_SS | Sky subtracted datacube |
| 5 | SPEC_NONSS | Non sky subtracted 1D spectrum |
| 6 | SPEC_SS | Sky subtracted 1D spectrum |
| 7 | COLCUBE_NONSS | Non sky subtracted collapsed datacube image |
If the sky-subtraction process is unsuccessful, the corresponding HDUs (*_SS) will be blank. One-dimensional spectra (SPEC_*) are constructed using only the flux from the brightest five fibres.
Data that has been processed successfully by both pipelines will
have a filename ending in "_2.fits".
Pipeline in Detail
The L2 pipeline reduction process uses three files, the "target" frame, the "arc" frame and the "continuum" frame. The pipeline can be visualised using the following schematic:

- Fibre tramline map generation using the continuum frame and polynomial tracing
frfind, frclean, frtrace
The positions of the fibre profile peaks are determined and polynomial traces determined for each. - Standard aperture flux extraction
frextract
Using the tramline mappings, the flux is extracted from each fibre in the target frame, continuum frame and arc frame using a 5 partial pixel aperture. - Wavelength mapping on a fibre-to-fibre basis
frarcfit
Candidate lines are found in the arc RSS frame and their positions compared with a reference list containing known arc line pixel positions and corresponding wavelengths. Lines are then matched and pixel to wavelength calibrations determined for each spectrum. - Fibre transmission correction
frcorrectthroughput
Using a continuum RSS frame, fibre-to-fibre throughput differences in the target RSS frame are normalised. - Rebinning of data to a linear wavelength calibration
frrebin
In order to obtain a single wavelength solution applicable to all fibres, the flux from each spectrum in the target RSS frame is rebinned using linear interpolation to a linear wavelength scale with the same starting/ending wavelength positions and pixel scales. - Sky subtraction (if applicable)
frsubsky
If the routine can successfully identify sky-only fibres, the sky flux contribution is removed for all spectra in the target RSS frame. In short, the pipeline first totals the flux through each fibre to construct a complete dataset of fibres fluxes. This dataset is filtered to remove "target" fibres (those it identifies as containing target flux) by an iterative sigma clip. This proceeds until no more target fibres are identified, resulting in the aggregation of a "sky-only" fibre dataset. This sky-only dataset is then compared to the complete dataset, checking to see if i) that the complete dataset has not been entirely identified as sky, and ii) that the mean of the sky-only dataset is within a certain percentile of the complete dataset. The latter is a constraint to sift out extended sources. More on this can be found in the paper linked above. - Formatting of output data product
frreformat
A data product with the output format shown above is constructed.
Plotting with astropy, specutils and matplotlib
Following are some examples of using specutils and Astropy to plot FRODO spectra in Python. With any moderately good signal-to-noise point source the pipeline will normally do an adequate job of selecting which fibres to extract and coadd them for you in FITS extensions 5[SPEC_NONSS] and 6[SPEC_SS]. For extended or extremely faint sources, the following examples demonstrate selecting the optimum fibres for yourself.
A simple python script is available for download (frodo_splot.py) to plot the pipeline's final extracted, coadded specturm. Either the sky-subtracted or non-sky-subtracted versions may be displayed. It is only a minimal demonstration and not a full plotting application. Assuming you already have all the Python dependencies installed, it may be run:
    python frodo_splot.py b_e_20190905_7_1_0_2.fits -x 6
    python frodo_splot.py -h          # to get syntax help
The next, more complicated example uses the sky-subtracted data cube in FITS extension 4[CUBE_SS] and allows you to select only certain fibres for inclusion in the co-added result.

Selecting five fibres by eye from the COLCUBE IFU reconstruction image and coadding those selected fibres. Note how much the individual fibres differ due to differential atmospheric refraction. In order to obtain accuate spectrophotometry, all fibres that contain flux would need to be combined.
    import numpy as np
    from astropy.io import fits
    from astropy import units as u
    from matplotlib import pyplot as plt
    from astropy.visualization import quantity_support
    import astropy.wcs as fitswcs
    import specutils as sp
    quantity_support()

    # Read the FITS extension 4[CUBE_SS]
    f = fits.open("FILENAME.FITS")
    specarray = f[4].data
    specheader = f[4].header
    specheader['CUNIT3'] = 'Angstrom'
    my_wcs = fitswcs.WCS(specheader)
    f.close()

    # Select the fibres to plot from FITS extension 7[COLCUBE]
    # Pixel coordinates following the typical FITS convention of a
    # raster-scan from bottom-left to top-right
    #   1,1  is bottom-left pixel in the COLCUBE image
    #   12,1 is bottom-right pixel
    #   1,12 is top-left pixel
    # In contrast, fibres map from IFU to their sequence on the slit
    # in boustrophedon manner from bottom-left to top-right.
    fibresToPlot = [(7,7),(8,7),(7,8),(6,7),(8,8)]
    countToPlot = len(fibresToPlot)

    # Retain just the listed fibres to plot.
    dataToPlot = np.zeros((countToPlot,specarray.shape[0]))
    for ii in range(0, countToPlot) :
      dataToPlot[ii,:] = specarray[:,fibresToPlot[ii][1]-1,fibresToPlot[ii][0]-1]

    # Create a Spectrum1D object containing the five separate fibres
    dataToPlot = dataToPlot * u.Unit("adu")
    sp1d = sp.Spectrum1D(flux=dataToPlot,wcs=my_wcs)

    fig = plt.figure(figsize=(12, 4), dpi=80, facecolor='w', edgecolor='k')
    ax = plt.axes()
    for ii in range(0, countToPlot):
      plt.plot(sp1d.spectral_axis,sp1d.flux[ii],label='Fibre '+str(fibresToPlot[ii]))

    # Coadd the five fibres into one total and plot the result
    sp1d = sp.Spectrum1D( flux=np.nansum(dataToPlot,axis=0), wcs=my_wcs)
    plt.plot(sp1d.spectral_axis, sp1d.flux, label='Coadded')
    plt.legend()
    plt.show()
Again a small python script (frodo_splot_cube.py) that uses the above method to plot a spectrum is available. It is only a minimal demonstration and not a full plotting application. Assuming you already have all the Python dependencies installed, it may be run:
    python frodo_splot_cube.py r_e_20190905_7_1_0_2.fits "(7,7),(8,7),(7,8),(6,7),(8,8)"
    python frodo_splot_cube.py -h          # to get syntax help
Finally, this example uses the linearized, sky-subtracted, 2D spectral stack FITS extension 3[RSS_SS].

Selecting four fibres by eye from the RSS FITS extension and coadding those selected fibres. Cosmic rays have not been filtered and are visible in the final stack
    import numpy as np
    from astropy.io import fits
    from astropy import units as u
    from matplotlib import pyplot as plt
    from astropy.visualization import quantity_support
    import astropy.wcs as fitswcs
    import specutils as sp
    quantity_support()

    # Read the FITS extension 3[RSS_SS]
    f = fits.open("FILENAME.FITS")
    specarray = f[3].data
    specheader = f[3].header
    specheader['CUNIT1'] = 'Angstrom'
    my_wcs = fitswcs.WCS(specheader)
    f.close()

    # Select the fibres to plot, counting up from the bottom of the RSS_SS
    # extension, starting from fibre 0, so the top row of image is fibre 143.
    #
    # To map from the COLCUBE image to position on the slit, start from the
    # bottom-left IFU pixel being fibre 0 and following a boustrophedon scan
    # to end with the top-right IFU pixel as 143.
    fibresToPlot = [66,67,76,77]
    countToPlot = len(fibresToPlot)
    mask = np.zeros(144, dtype=bool)
    mask.put(fibresToPlot,True)

    # Retain just the listed fibres to plot.
    dataToPlot = specarray[mask] * u.Unit("adu")

    # Create a Spectrum1D object containing the four separate fibres
    sp1d = sp.Spectrum1D(flux=dataToPlot, wcs=my_wcs)

    fig = plt.figure(figsize=(12, 4), dpi=80, facecolor='w', edgecolor='k')
    ax = plt.axes()
    for ii in range(0, countToPlot):
     plt.plot(sp1d.spectral_axis,sp1d.flux[ii],label='Fibre '+str(fibresToPlot[ii]))

    # Coadd the four fibres into one total and plot the result
    dataToPlot = np.sum(specarray[mask],axis=0) * u.Unit("adu")
    sp1d = sp.Spectrum1D(flux=dataToPlot,wcs=my_wcs)
    plt.plot(sp1d.spectral_axis,sp1d.flux,label='Coadded')
    plt.legend()
    plt.show()
Extraction using the Starlink software
Starlink users may extract the appropriate extension using the CONVERT:FITS2NDF command, appending the filename with the extension they wish to extract in brackets. The result is a single extension .SDF file.
For example, to extract the raw image from the multipart FITS file r_e_20100311_1_1_1_2.fits use:
  > convert
  > fits2ndf "r_e_20100311_1_1_1_2.fits[0]"
Or alternatively, you can access the required HDU by using the corresponding EXTNAME key:
> fits2ndf "r_e_20100311_1_1_1_2.fits[L1_IMAGE]"
Extraction using DS9
DS9 users may view the available extensions by adding -multiframe on the terminal command line:
> ds9 -multiframe r_e_20100311_1_1_1_2.fits
A frame extraction can be achieved by adding the -frame and -savetofits parameters, specifying the frame to be extracted (frame 1 corresponds to the primary HDU):
> ds9 -multiframe r_e_20100311_1_1_1_2.fits -frame 1 -savefits output.fits -quit
Wavelength and Flux Calibration

Xenon arc in FRODOspec blue grating ( bigger version (10.4kB))

Xenon arc in FRODOspec red grating ( bigger version (10.4kB))
FRODOspec contains two different calibration light sources that perform different functions:
- a xenon arc lamp is used for wavelength calibration
- a tungsten continuum lamp is used for fibre tracing, to calibrate the built-in spatial distortion in the system
Use of the lamps is not compulsory, but it is recommended because at present we do not know the long-term stability of the FRODOspec system. We therefore recommend a Xenon arc exposure is obtained every time the gratings are moved.
Movement of the grating plus arc and science exposures must be made in the correct sequence, not only to obtain correct calibration, but also to avoid the risk of the arc light causing loss of the guide star. The sequence should be:
- select grating
- obtain science data
- obtain xenon arc exposure
Although simultaneous observations of science or arcs in both red & blue arms are possible, it is NOT possible to take an arc in one arm while obtaining science data in the other. This is governed by the robotic control system, which if necessary will wait for science observing to finish in one arm before beginning an arc calibration in the other. This must be borne in mind both when calculating telescope time in phase 1 proposals and when scheduling observations in the phase 2.
All FRODOSpec data are flat-fielded and a sky-subtracted spectrum is created by the pipeline (and included in the reduced multi-extension FITS file) as described above. However, at the present time we do not apply any sort of flux calibration or telluric correction to pipeline-processed data. Users may therefore wish to add a standard star observation to their FRODOSpec observing sequence so that their calibration observations are matched in time and airmass with the science data; see the SPRAT Phase2 guidelines for details on how to do this using the Sequence Builder; the sequence of observations and configurations would be essentially the same for the two instruments. Links to tables of spectro-photometric standard stars are provided by ESO here.
Phase 1 Information
Overheads for compulsory and recommended FRODOspec actions are:
- Initialisation time (Ti, Miscellaneous overheads): 20 seconds.
- Acquisition time (slewing plus moving the target onto the fibre bundle): 4 minutes
- Each readout time: 20 seconds
- Grating change: 20 seconds
- Xenon arc exposure (recommended for wavelength calibration): 60 seconds
- Tungsten lamp exposure (recommended for fibre tracing): 60 seconds
Phase 2 Information
Guidelines on how to prepare observations are given in the Phase 2 web pages. Note in particular the instrument-specific User Interface Instructions. The phase 2 "Wizard" should always be used to prepare observations. Groups that can not be prepared with the wizard should be discussed with LT Phase 2 support. Note that LT staff do not routinely check observing groups, and that observing groups are potentially active as soon as they are submitted. Please do contact us if you have any questions about your observations.